Per Capita Gross Domestic Product Cartogram of the Constituent States of the United Kingdom
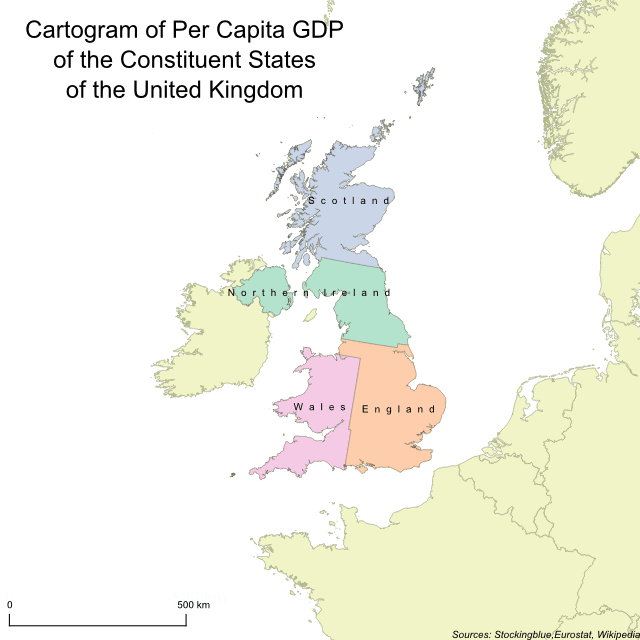
In this geographically accurate cartogram, the constituent states of the United Kingdom are redrawn according to their per capita gross domestic product (GDP). All four states of the United Kingdom are pretty equally sized which shows that the distribution of wealth between the constituent states is pretty even.
Gross Domestic Product Cartogram of the Constituent States of the United Kingdom
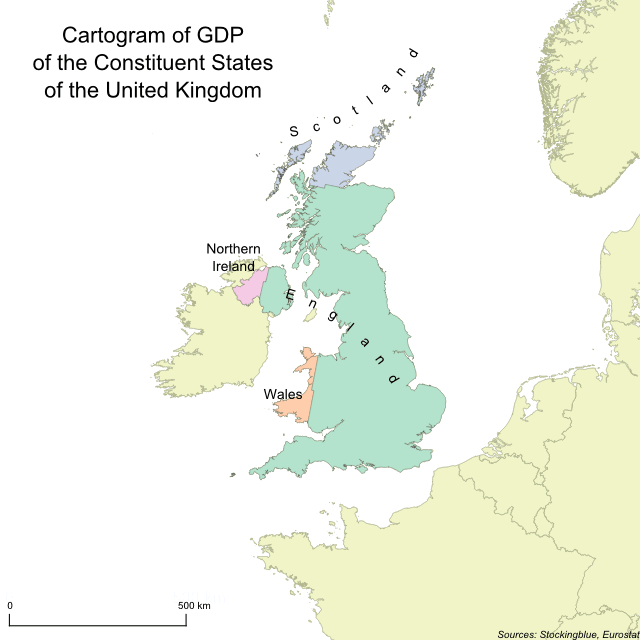
In this geographically accurate cartogram, the constituent states of the United Kingdom are redrawn according to their gross domestic product (GDP). England is the only state to gain territory at the expense of the other three and it gains more territory than it did when borders were redrawn for population.
Population Cartogram of Constituent States of the United Kingdom
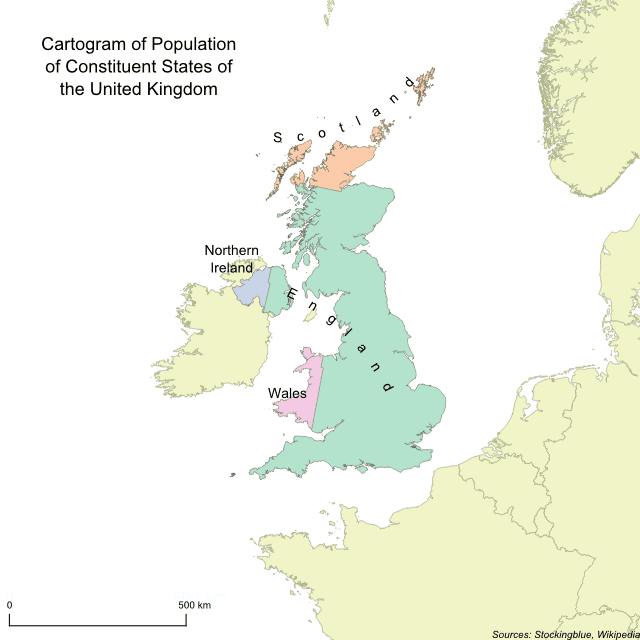
In this geographically accurate cartogram, the constituent states of the United Kingdom are redrawn according to their population. England is the only state to gain territory at the expense of the other three.
Air Travel per Capita in US States
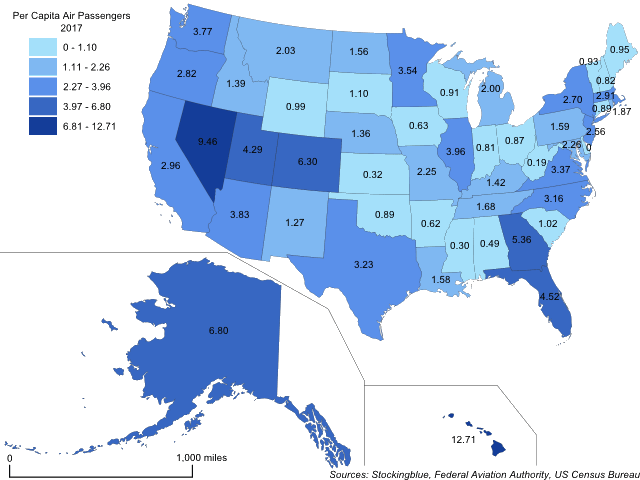
The map above shows the number of passengers that traveled by air for every resident in each US state. Hawaii is the only state to have more than ten air passengers for every resident in the state.
Air Travel per Capita in EU States
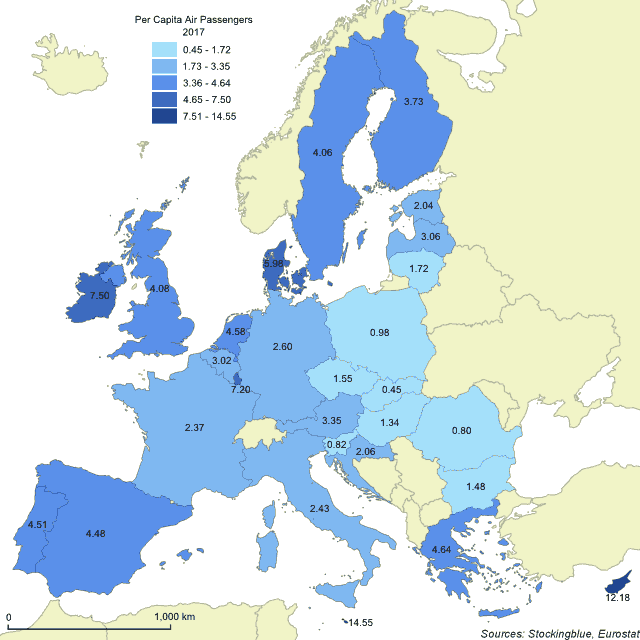
The map above shows the number of passengers that traveled by air for every resident in each EU state. The two island states of Cyprus and Malta have a commanding lead over all other EU states and are the only two states with more than ten air passengers for every inhabitant.
Air Travel in US States
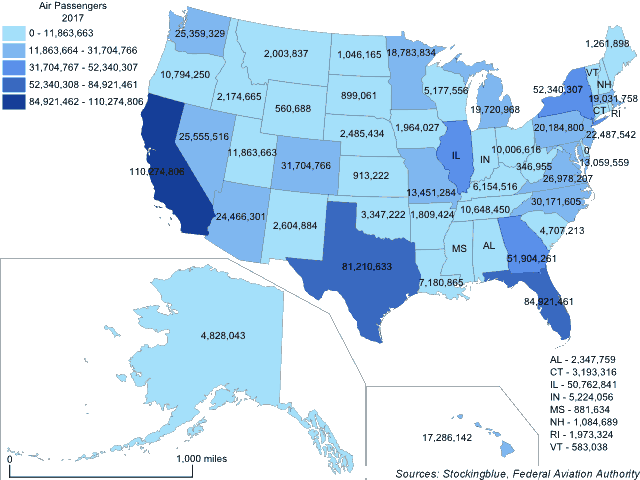
The map above shows the number of passengers that traveled by air in each US state. California has a commanding lead over every other US state.
Air Travel in EU States
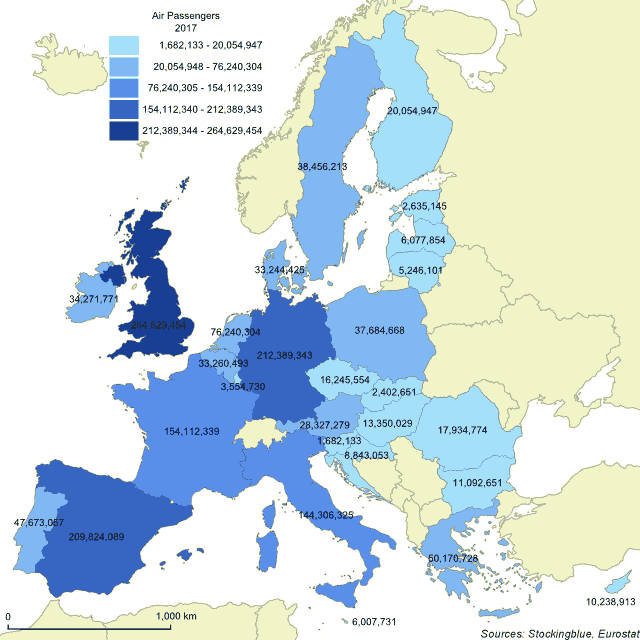
The map above shows the number of passengers that traveled by air in each EU state. The United Kingdom has a commanding lead over every other EU state.
Busy Commercial Airports per Area in US States
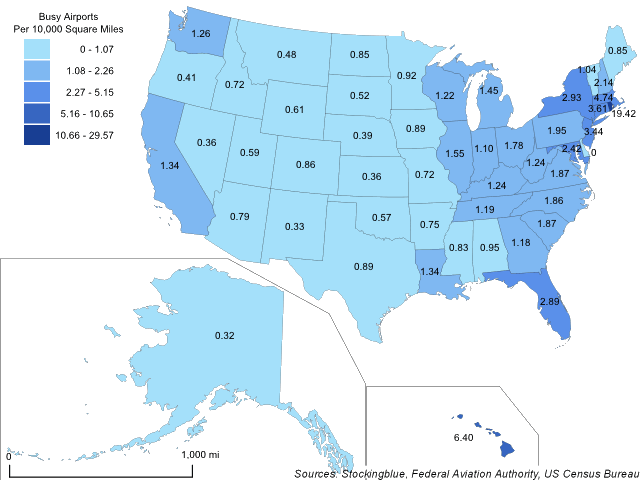
The map above shows the number of airports that serve at least 15,000 passengers per year for every 10,000 square miles in each US state. Rhode Island has the most busy airports per square mile.
Busy Commercial Airports per Area in EU States
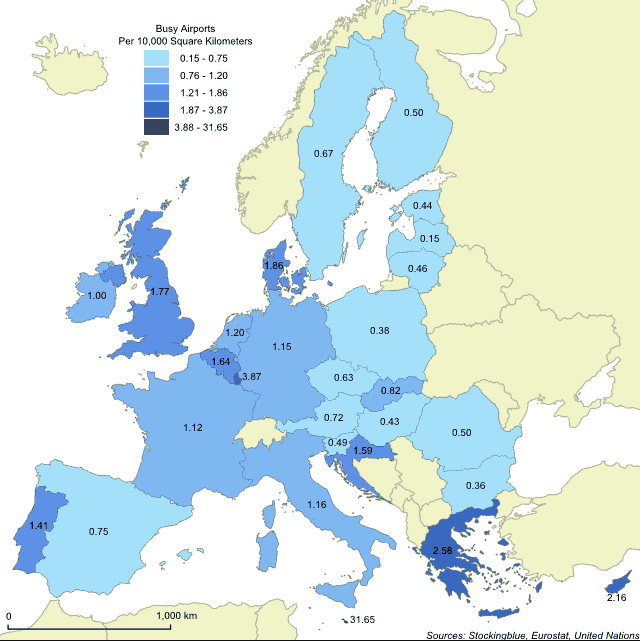
The map above shows the number of airports that serve at least 15,000 passengers per year for every 10,000 square kilometers in each EU state. Malta has the most busy airports per square kilometer.
Busy Commercial Airports per Million People in US States
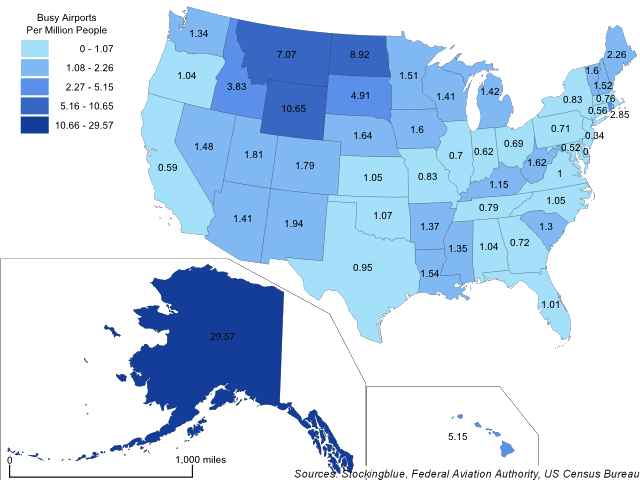
The map above shows the number of airports that serve at least 15,000 passengers per year for every million residents in each US state. Alaska has the most airports per capita by a large margin.
Older