The Correlation between GDP PPP Per Capita and GDP PPP Per Area in North America
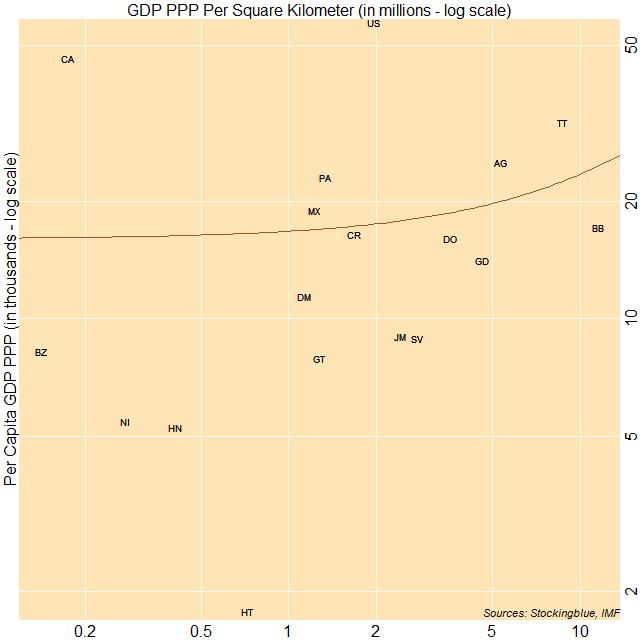
The correlation between per capita gross domestic product based on purchasing power parity (GDP PPP) and GDP PPP per area in North America is almost nonexistent. The three largest economies on a per capita basis have either a very low, moderate, or high per area GDP.
Gross Domestic Product by Arable Land in North America
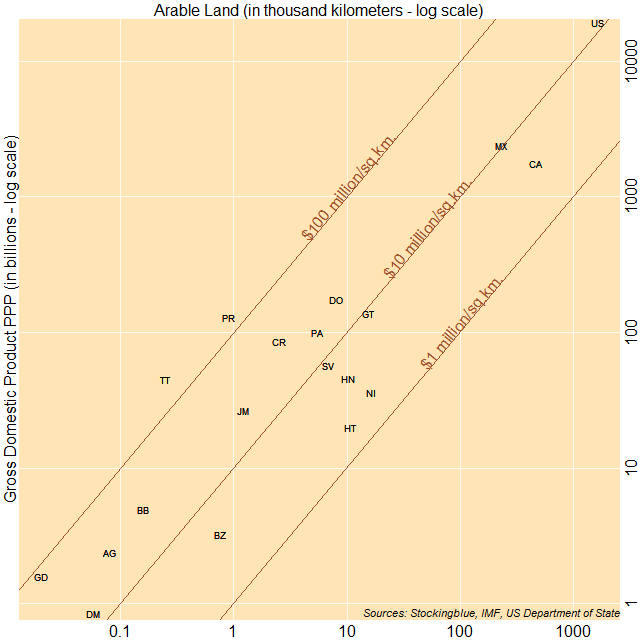
The chart above shows economic output as it relates to arable land. The countries to the top left have a larger ratio of gross domestic product (GDP) to arable land, while countries to the bottom right have a smaller ratio of GDP to arable land. Puerto Rico, Trinidad and Tobago, and Grenada have the largest ratio of GDP to area whereas Haiti, Canada, and Nicaragua have the smallest ratio of GDP to area.
Gross Domestic Product by Land Area in North America
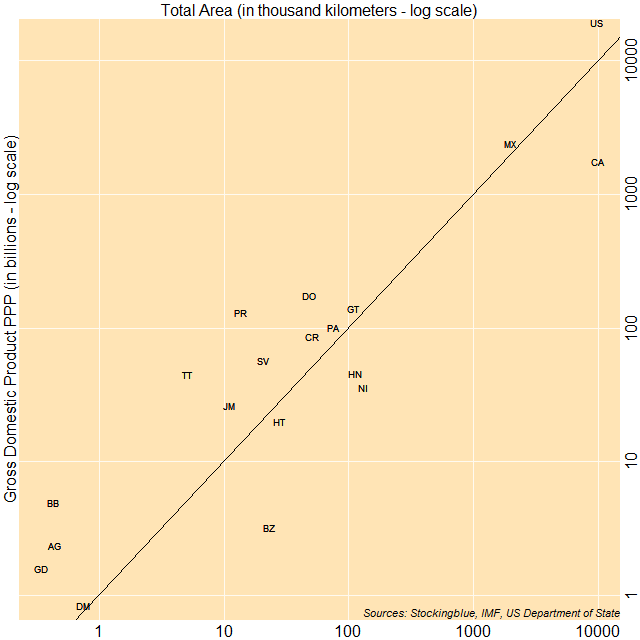
The chart above shows economic output as it relates to land area. The countries to the top left of the diagonal line have a gross domestic product (GDP) of over one million international dollars per square kilometer, while countries to the bottom right have a GDP that is less than one million dollars per square kilometer. Puerto Rico, Trinidad and Tobago, and Barbados have the largest ratio of GDP to area whereas Nicaragua, Canada, and Belize have the smallest ratio of GDP to area.
The Correlation between Minimum Wage and Shadow Economies in North America
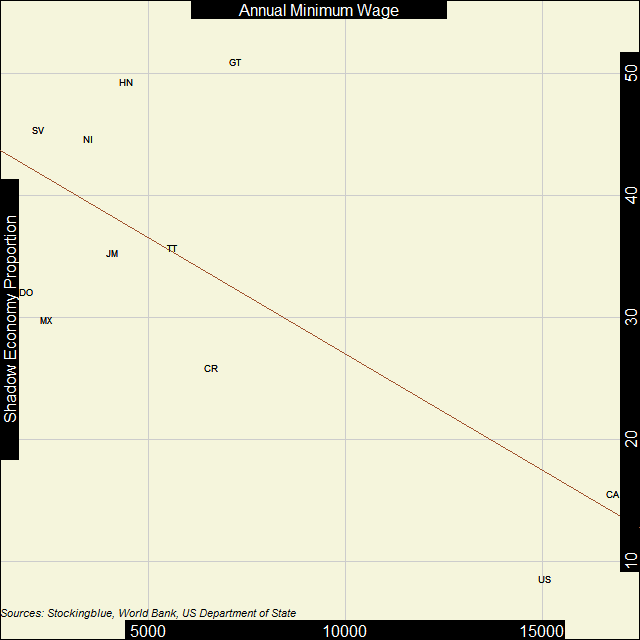
In North America, the inverse correlation between the strength of the shadow economy and the minimum wage is somewhat strong. As the proportion of the shadow economy decreases, the minimum wage tends to go up.
The Correlation between Minimum Wage and Economic Strength in North America
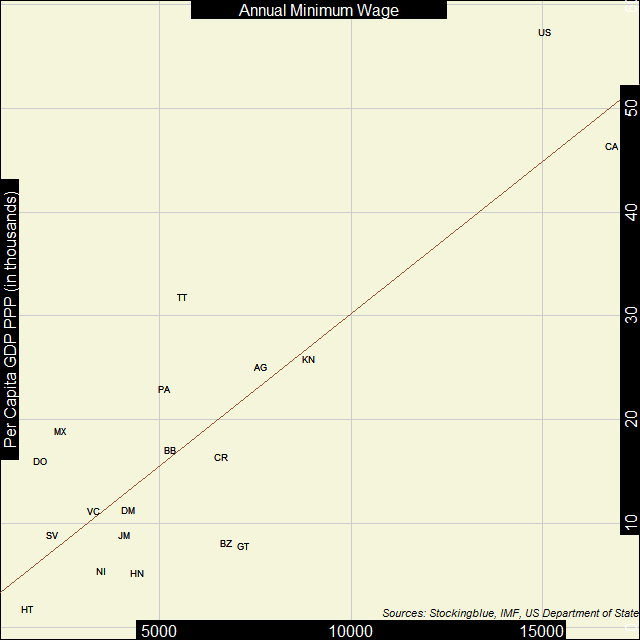
In North America, the correlation between economic strength and minimum wage is strong. Only two countries on the continent have an annual minimum wage of over 15,000 international dollars, Canada and the United States. All other countries' annual minimum wage is below 9,000 international dollars.
The Correlation between Shadow Economies and Economic Strength in North America
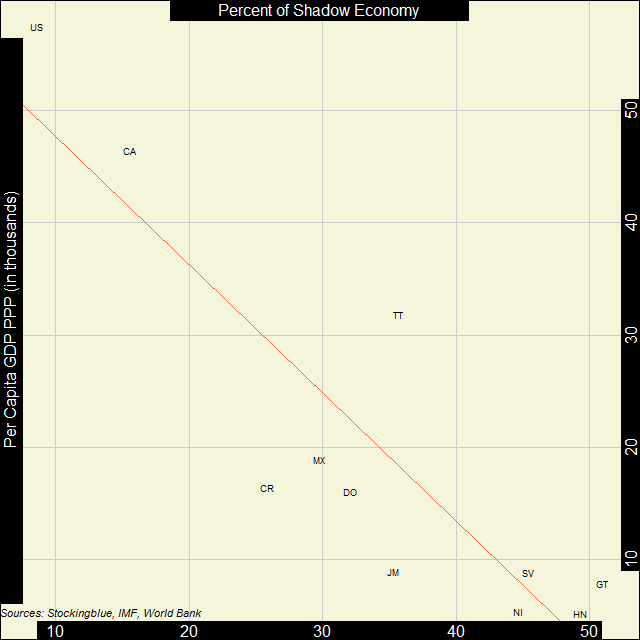
In North America, the indirect correlation between economic strength and the strength of the shadow economy is very strong. The United States and Canada have by far the largest economies and the smallest proportion of underground activity.