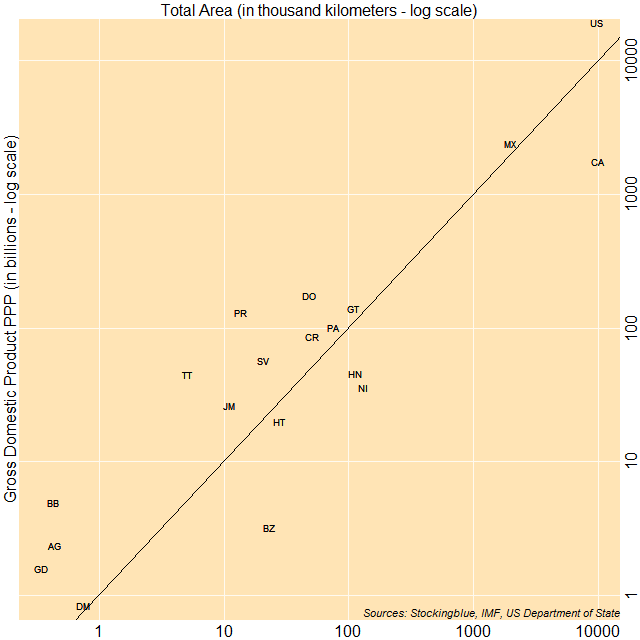
The chart above shows economic output as it relates to land area. The countries to the top left of the diagonal line have a gross domestic product (GDP) of over one million international dollars per square kilometer, while countries to the bottom right have a GDP that is less than one million dollars per square kilometer. Puerto Rico, Trinidad and Tobago, and Barbados have the largest ratio of GDP to area whereas Nicaragua, Canada, and Belize have the smallest ratio of GDP to area.
Findings
- Most countries with a GDP per square kilometer of under one million international dollars are from Central America. Canada and Haiti also make the list.
- Belize has the smallest ratio of GDP to area with an economy of just over 140,000 times that of its area in square kilometers.
- Barbados has the largest ratio of GDP to area with an economy of over 11 million times that of its area in square kilometers.
- Only Haiti, Honduras, Nicaragua, Canada, and Belize have a GDP that is less than one million international dollars per square kilometer.
Caveats
- A country with a large landmass and a small population is likely to have a smaller ratio, whereas a small country with a large population density can have a larger ratio. Thus the data may not reflect how productive a country is.
- Anguilla, Aruba, Bahamas, Bermuda, Cayman Islands, Cuba, Curaçao, Greenland, Guadeloupe, Martinique, Montserrat, Saint Kitts and Nevis, Saint Lucia, Saint Martin, Saint Pierre and Miquelon, Saint Vincent and the Grenadines, Sint Maarten, Turks and Caicos Islands, the British Virgin Islands, and the US Virgin Islands were missing data.
Details
Canada is the one country that sticks out, as its huge expanse within and in close proximity to the Arctic Circle may be responsible for such a small ratio, the second smallest on the continent.
The United States is pretty impressive because even though it has the second largest area, it still manages to have a GDP that is produces nearly 2 million international dollars per square kilometer.
Data
| Code | Country | Area (square km) | GDP (in millions) | GDP Per Square Kilometer |
|---|---|---|---|---|
| BZ | Belize | 22,966 | 3,252 | 141,600.6 |
| CA | Canada | 9,984,670 | 1,752,910 | 175,560.1 |
| NI | Nicaragua | 130,370 | 35,835 | 274,871.5 |
| HN | Honduras | 112,090 | 45,628 | 407,065.8 |
| HT | Haiti | 27,750 | 19,979 | 719,964.0 |
| DM | Dominica | 751 | 847 | 1,127,829.6 |
| MX | Mexico | 1,964,375 | 2,406,199 | 1,224,918.4 |
| GT | Guatemala | 108,889 | 138,987 | 1,276,409.9 |
| PA | Panama | 75,420 | 100,512 | 1,332,696.9 |
| CR | Costa Rica | 51,100 | 85,781 | 1,678,688.9 |
| US | United States | 9,833,517 | 19,417,144 | 1,974,587.9 |
| JM | Jamaica | 10,991 | 26,474 | 2,408,698.0 |
| SV | El Salvador | 20,720 | 57,285 | 2,764,720.1 |
| DO | Dominican Republic | 48,670 | 174,180 | 3,578,796.0 |
| GD | Grenada | 344 | 1,588 | 4,616,279.1 |
| AG | Antigua and Barbuda | 443 | 2,372 | 5,354,401.8 |
| TT | Trinidad and Tobago | 5,128 | 44,654 | 8,707,878.3 |
| PR | Puerto Rico | 13,791 | 129,848 | 9,415,415.8 |
| BB | Barbados | 431 | 4,983 | 11,561,484.9 |
Sources
US Department of State. 2017. "The World Factbook." Accessed September 21, 2017. https://www.cia.gov/library/publications/the-world-factbook/fields/2147.html.