EU and US Regional Crude Oil Production, January 2019

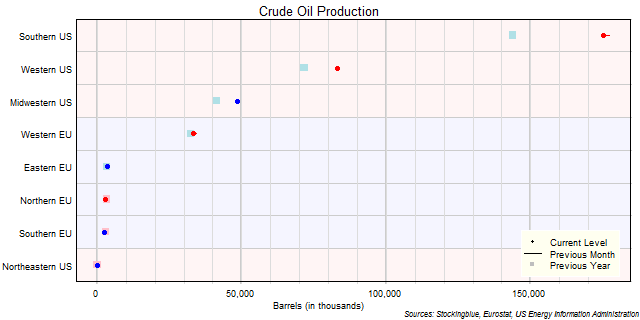
The chart above shows the crude oil production in each EU and US region as of January 2019 in thousands of barrels, the change from the previous month, and the production one year prior. The Northeast produces almost no crude at all.
EU Regional Crude Oil Production, January 2019

The chart above shows the crude oil production in each EU region as of January 2019 in thousands of metric tons, the change from the previous month, and the production one year prior. The Eastern EU surpassed the Northern EU in crude production.
US Regional Crude Oil Production, January 2019

The chart above shows the crude oil production in each US region as of January 2019 in thousands of barrels, the change from the previous month, and the production one year prior. The Northeast produces almost no crude at all.
EU and US Crude Oil Production, January 2019

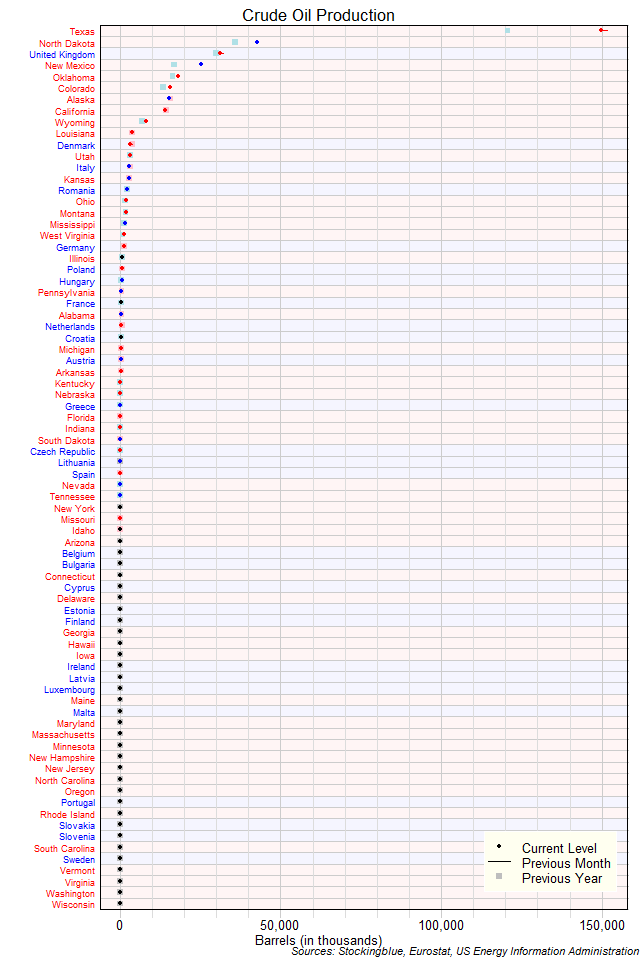
The chart above shows the crude oil production in each EU and US state as of January 2019 (unless otherwise noted - see caveats below) in thousands of barrels, the change from the previous month, and the production one year prior. Texas produces three times more crude oil than the entire EU combined.
EU Crude Oil Production, January 2019

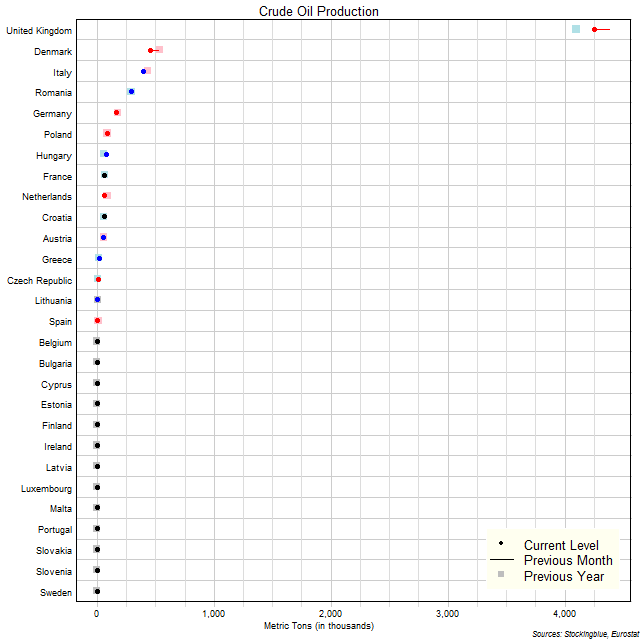
The chart above shows the crude oil production in each EU state as of January 2019 (unless otherwise noted - see caveats below) in thousands of metric tons, the change from the previous month, and the production one year prior. The United Kingdom dominates over the other states.
US Crude Oil Production, January 2019

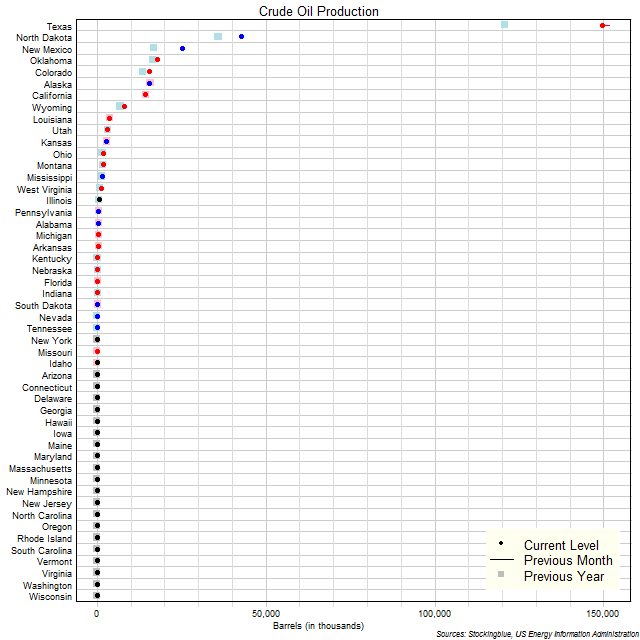
The chart above shows the crude oil production in each US state as of January 2019 in thousands of barrels, the change from the previous month, and the production one year prior. Texas is in a league all its own.