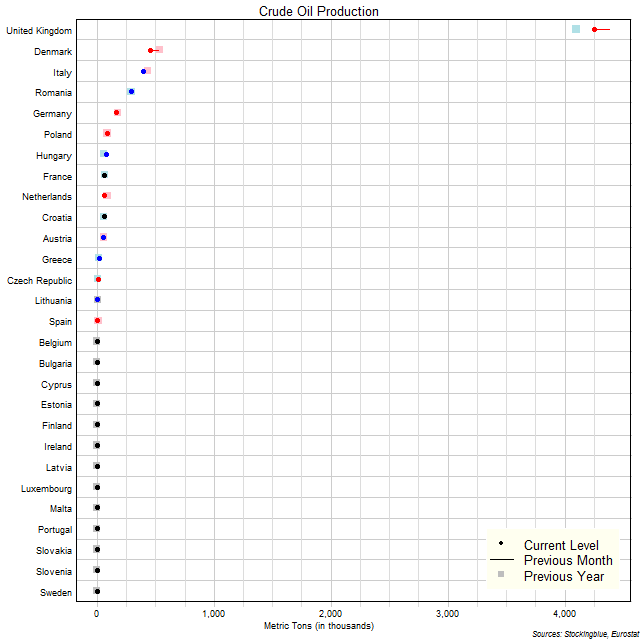
The chart above shows the crude oil production in each EU state as of January 2019 (unless otherwise noted - see caveats below) in thousands of metric tons, the change from the previous month, and the production one year prior. The United Kingdom dominates over the other states.
Findings
- The difference between the state with the greatest production, the United Kingdom, and the states with the least (that produces crude oil), Spain and Lithuania, is 4,248 thousand metric tons (down from 4,380 last month and up from 4,093 last year). The United Kingdom and Lithuania had the greatest and least production respectively both last month and last year.
- The United Kingdom has 1,063 times the production that Spain and Lithuania does. The ratio of highest production to lowest production was down from 1,461 last month and up from 1,024 last year.
- The median crude production in the 28 EU states is 4 thousand metric tons (down from 4.5 last month and down from 5.5 last year) and the mean 214.30 thousand metric tons (down from 221.25 the previous month but up from 213.71 last year).
- The median crude production in the 15 EU states that produce crude is 65 thousand metric tons (down from 67 last month but up from 63 last year) and the mean 400 thousand metric tons (down from 413 the previous month but up from 398.9 last year).
- Fifteen states did not see a change in their crude production from the previous month, 6 produced more, and 7 states produced less.
- Fourteen states did not see a change in their crude production from last year, while 7 increased production, and 7 decreased production.
Caveats
- Data is from January 2019 except for Greece, Malta, and the Netherlands which are from December 2018 and Germany which is from November 2018.
- All figures are rounded to the nearest hundredth.
Details
In absolute terms, the United Kingdom saw the largest decrease over the previous month with a drop of 131 thousand metric tons. Hungary had the biggest spike in production with a gain of 12 thousand metric tons. Year over year, Denmark had the largest decrease with a drop of 80 thousand metric tons while the United Kingdom had the greatest increase with a gain of 155 thousand metric tons.
In relative terms, Spain had the greatest decrease over the previous month with a 32.33% drop in production while Lithuania had the greatest increase with a 33.33% gain in production. Year over year, Spain had the greatest decrease with a 60.00% drop in its production while Hungary had the greatest increase with a 38.60% gain in production.
The United Kingdom accounted for nearly three-quarters of the production of crude in the Union at 70.87%. It, with Denmark accounted for just over three-fourths of the entire crude production in the EU at 78.42%. Adding in Italy, Romania, and Germany amounts to nine-tenths of the EU total at 92.58%.
Hungary, France, and Lithuania rose one spot in the crude production rankings; Hungary and France both surpassed the Netherlands (which dropped the most - two spots) while Hungary caught up to Spain. Year over year, Hungary rose three spots surpassing the Netherlands (which dropped three spots - the most for the year), France, and Austria going from a rank of 10 last year to a rank of 7 this month.
Sources
Eurostat. 2019. "Supply and Transformation of Oil - Monthly Data." Accessed May 15, 2019. http://appsso.eurostat.ec.europa.eu/nui/show.do?query=BOOKMARK_DS-075785_QID_-78955871_UID_-3F171EB0&layout=TIME,C,X,0;GEO,L,Y,0;UNIT,L,Z,0;PRODUCT,L,Z,1;INDIC_NRG,L,Z,2;INDICATORS,C,Z,3;&zSelection=DS-075785INDICATORS,OBS_FLAG;DS-075785PRODUCT,3105;DS-075785INDIC_NRG,B_100100;DS-075785UNIT,THS_T;&rankName1=UNIT_1_2_-1_2&rankName2=INDICATORS_1_2_-1_2&rankName3=PRODUCT_1_2_-1_2&rankName4=INDIC-NRG_1_2_-1_2&rankName5=TIME_1_0_0_0&rankName6=GEO_1_2_0_1&sortC=ASC_-1_FIRST&rStp=&cStp=&rDCh=&cDCh=&rDM=true&cDM=true&footnes=false&empty=false&wai=false&time_mode=NONE&time_most_recent=false&lang=EN&cfo=%23%23%23%2C%23%23%23.%23%23%23.