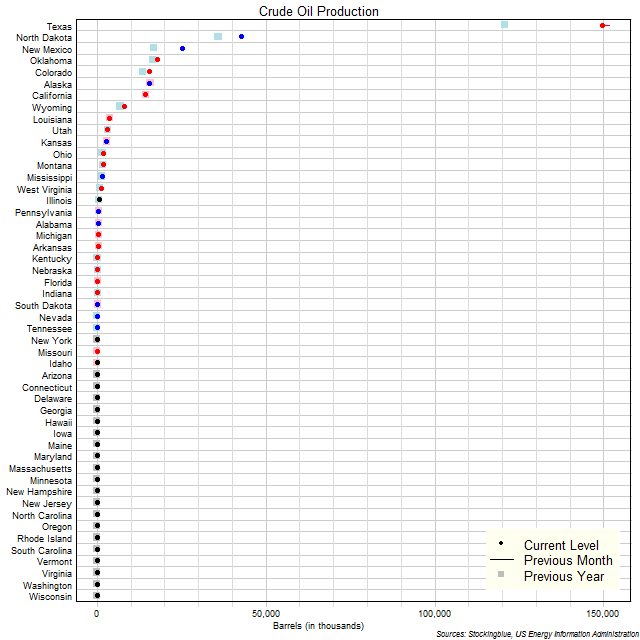
The chart above shows the crude oil production in each US state as of January 2019 in thousands of barrels, the change from the previous month, and the production one year prior. Texas is in a league all its own.
Findings
- The difference between the state with the greatest production, Texas, and the state with the least (that produces crude oil), Arizona, is 149,703 thousand barrels (down from 151,760 last month and up from 120,707 last year). Texas and Arizona had the greatest and least production respectively both last month and last year.
- Texas has 149,704 times the production that Arizona does. The ratio of highest production to lowest production was down from 151,761 last month and up from 120,708 last year.
- The median crude production in the 50 US states is 63 thousand barrels (up from 61 last month and up from 43 last year) and the mean 6,170 thousand barrels (down from 6,227 the previous month but up from 5,177 last year).
- The median crude production in the 31 US states that produce crude is 755 thousand barrels (same as last month but up from 599 last year) and the mean 9,952.1 thousand barrels (down from 10,043.8 the previous month but up from 8,350 last year).
- Twenty-three states did not see a change in their crude production from the previous month, 10 produced more, and 17 states produced less.
- Twenty-one states did not see a change in their crude production from last year, while 17 increased production, and 12 decreased production.
Caveats
- Data is from January 2019.
- All figures are rounded to the nearest hundredth.
Details
In absolute terms, Texas saw the largest decrease over the previous month with a drop of 2,057 thousand barrels. North Dakota had the biggest spike in production with a gain of 277 thousand barrels. Year over year, Alaska had the largest decrease with a drop of 356 thousand barrels while Texas had the greatest increase with a gain of 28,996 thousand barrels.
In relative terms, Kentucky had the greatest decrease over the previous month with a 32.45% drop in production while Tennessee had the greatest increase with a 17.65% gain in production. Year over year, Idaho had the greatest decrease with a 40.00% drop in its production while Kentucky had the greatest increase with a 184.13% gain in production.
Texas accounted for nearly half the production of crude in the country at 48.52%. It, with North Dakota, New Mexico, and Oklahoma accounted for just over three-fourths of the entire crude production in the US at 76.38%. Adding in Colorado, Alaska, and California amounts to nine-tenths of the US total at 90.99%.
Pennsylvania saw the largest jump in crude production rankings going from a rank of 19 last month to a rank of 17 this month. It bested Alabama (from 17 to 18) and Michigan (from 18 to 19) who both fell one spot in the rankings. Year over year, Kentucky saw the largest gain in rank going from a rank of 25 last year to a rank of 21 this month. Six states fell one spot from last year to this (in descending order of production): Alaska, California, Montana, Florida, Indiana, and South Dakota.
Sources
US Energy Information Administration. 2019. "Crude Oil Production." Accessed May 14, 2019. https://www.eia.gov/dnav/pet/pet_crd_crpdn_adc_mbbl_m.htm.