US Regions by Area

The chart above shows the area of each of the US regions. The Western US is so large that it takes all the three other regions to match its size.
EU Regions by Area

The chart above shows the area of each of the EU regions. Unlike population distribution and economic might, the land that the four major regions of the Union take up is relatively equal.
Comparison of EU and US States by Area
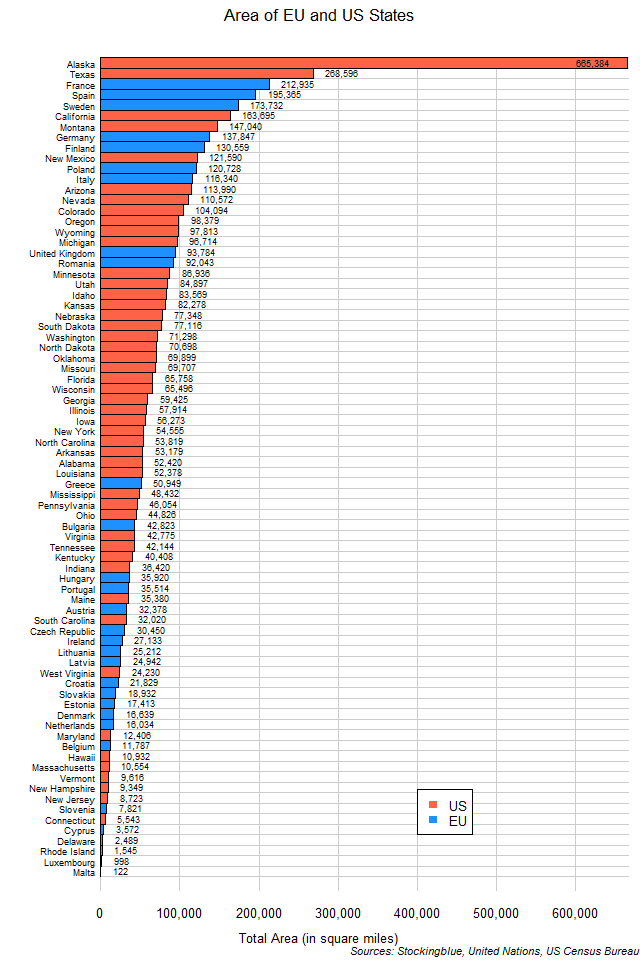
The chart above shows the area of each of the EU and US states. Alaska is so huge that it takes the next three largest states (Texas, France, and Spain) to rival its area.
Comparison of EU States by Area
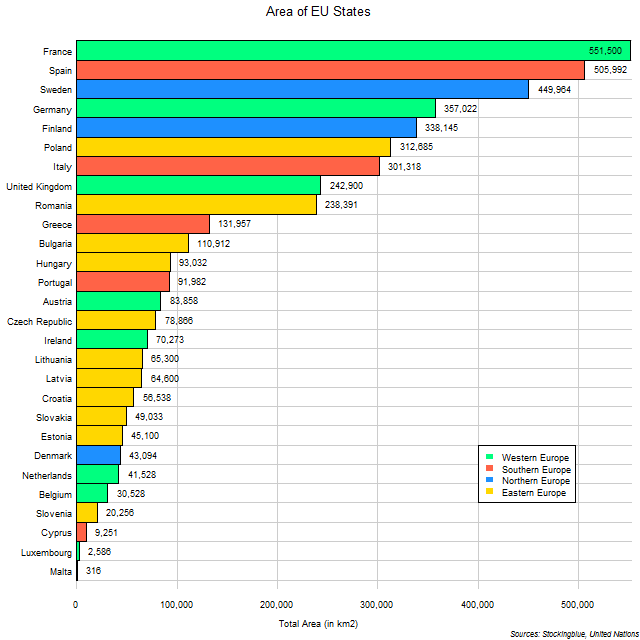
The chart above shows the area of each of the EU states. France, Spain, and Sweden are the only states with over 400,000 square kilometers.
Comparison of US States by Area
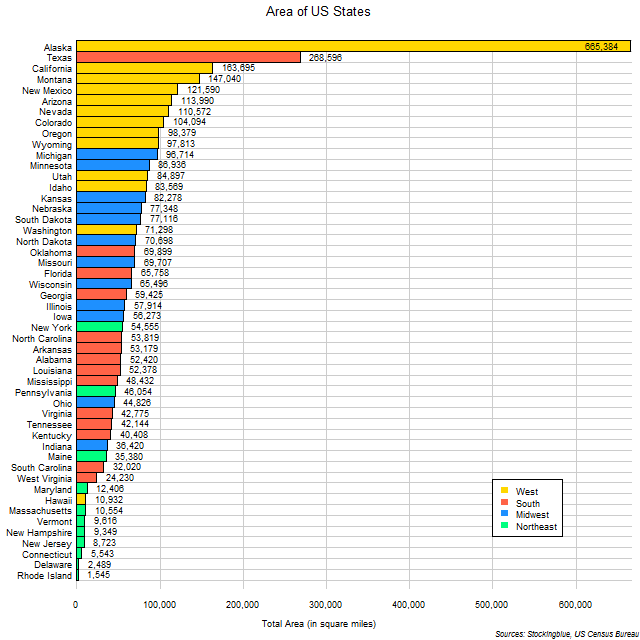
The chart above shows the area of each of the US states. Alaska and the Western US dominate the American expanse.
Gross Domestic Product by Arable Land Worldwide
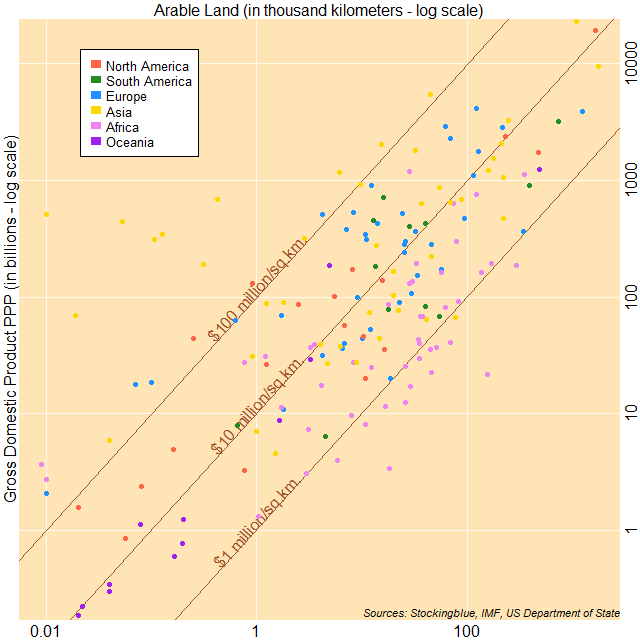
The chart above shows economic output as it relates to arable land. The countries to the top left have a larger ratio of gross domestic product (GDP) to arable land, while countries to the bottom right have a smaller ratio of GDP to arable land. Asia has the countries that have the largest ratio of GDP to area whereas Africa has the countries that have the smallest ratio of GDP to area.
Gross Domestic Product by Arable Land in Oceania
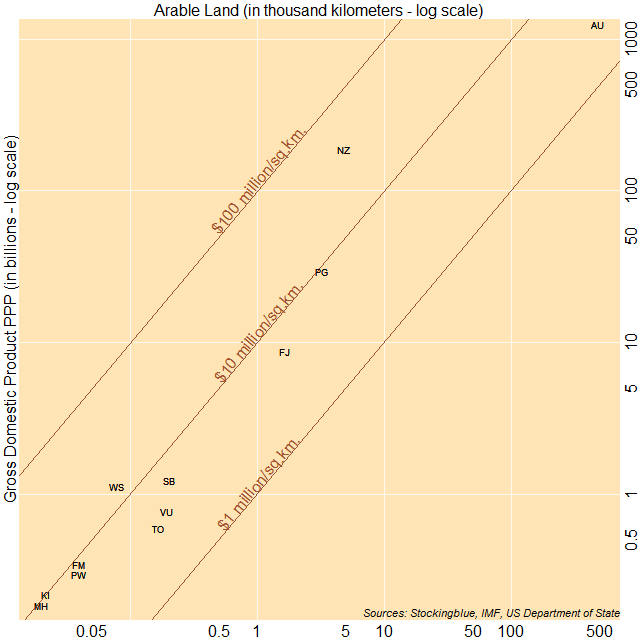
The chart above shows economic output as it relates to arable land. The countries to the top left have a larger ratio of gross domestic product (GDP) to arable land, while countries to the bottom right have a smaller ratio of GDP to arable land. New Zealand, Samoa, and Kiribati have the largest ratio of GDP to area whereas Australia, Tonga, and Vanuatu have the smallest ratio of GDP to area.
Gross Domestic Product by Arable Land in Africa
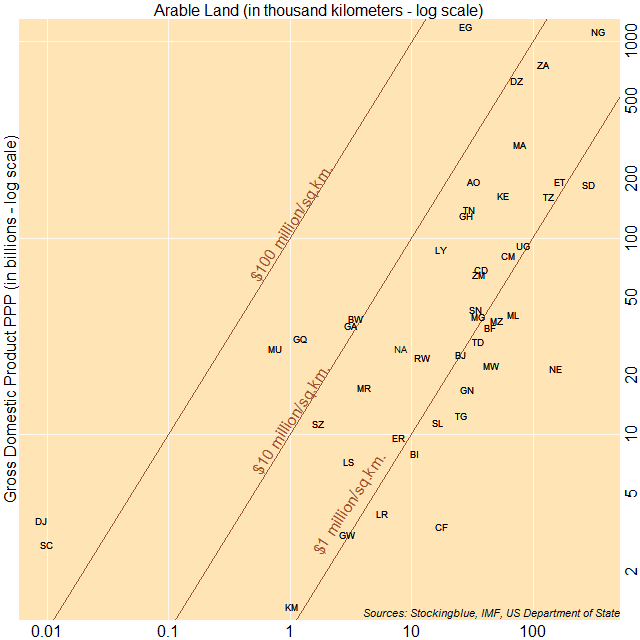
The chart above shows economic output as it relates to arable land. The countries to the top left have a larger ratio of gross domestic product (GDP) to arable land, while countries to the bottom right have a smaller ratio of GDP to arable land. Singapore, Hong Kong, and Bahrain have the largest ratio of GDP to area whereas Afghanistan, Cambodia, and Kazakhstan have the smallest ratio of GDP to area.
Gross Domestic Product by Arable Land in Asia
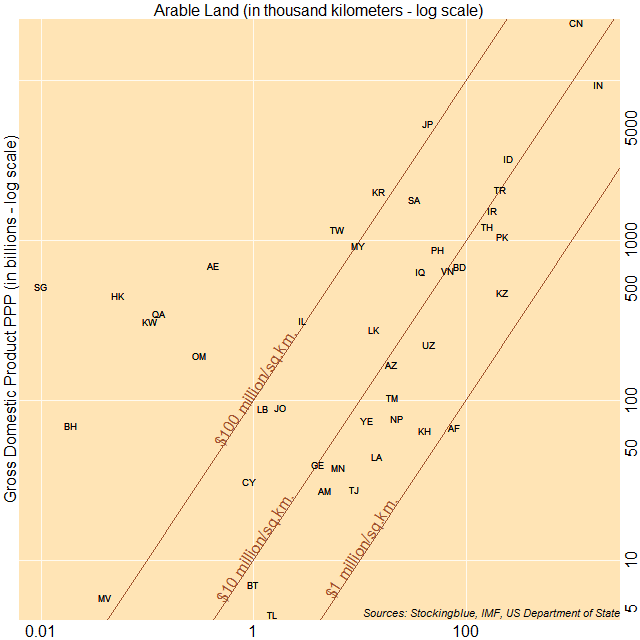
The chart above shows economic output as it relates to arable land. The countries to the top left have a larger ratio of gross domestic product (GDP) to arable land, while countries to the bottom right have a smaller ratio of GDP to arable land. Singapore, Hong Kong, and Bahrain have the largest ratio of GDP to area whereas Afghanistan, Cambodia, and Kazakhstan have the smallest ratio of GDP to area.
Gross Domestic Product by Arable Land in Europe
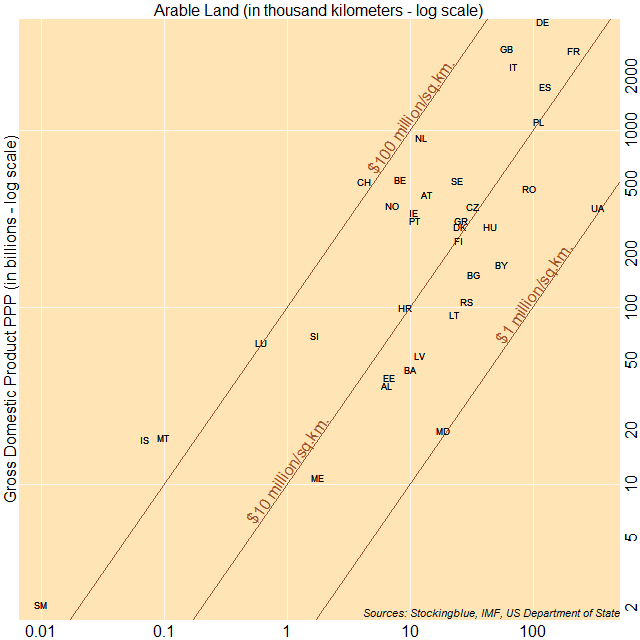
The chart above shows economic output as it relates to arable land. The countries to the top left have a larger ratio of gross domestic product (GDP) to arable land, while countries to the bottom right have a smaller ratio of GDP to arable land. Iceland, San Marino, and Malta have the largest ratio of GDP to area whereas Moldova, Ukraine, and Belarus have the smallest ratio of GDP to area.
OlderNewer