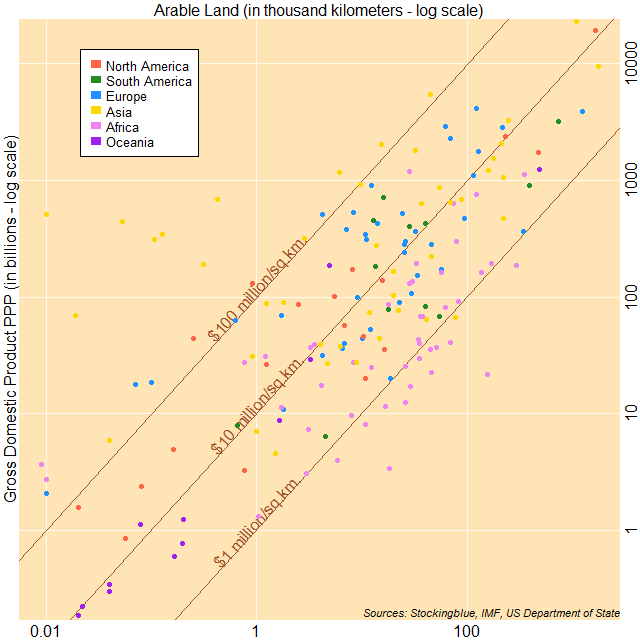
The chart above shows economic output as it relates to arable land. The countries to the top left have a larger ratio of gross domestic product (GDP) to arable land, while countries to the bottom right have a smaller ratio of GDP to arable land. Asia has the countries that have the largest ratio of GDP to area whereas Africa has the countries that have the smallest ratio of GDP to area.
Findings
- South America and Oceania are the only two continents where no countries make over 100 million international dollars per square kilometer of arable land.
- Fourteen of the 15 countries that make less than one million international dollars per square kilometer of arable land are in Africa. The other one is in Asia.
- All six countries that make more than one billion international dollars per square kilometer of arable land are in Asia.
- Of the ten countries with the highest GDP per square kilometer of arable land, eight are from Asia. Europe and Africa have the other two.
Caveats
- Arable land may be a better attribute to use than total land area because it indicates where people are willing to live however, countries are likely to have resources beyond what can be found within their arable lands.
- Several countries are not included as they were missing data. See the continent reports for complete lists.
Details
Asia has several countries with large economies with very little arable land that dwarf the economies of countries with considerably more arable land.
Most of the world's countries make between one million and 100 million international dollars per square mile of arable land.
Sources
US Department of State. 2017. "The World Factbook." Accessed September 21, 2017. https://www.cia.gov/library/publications/the-world-factbook/fields/2147.html.