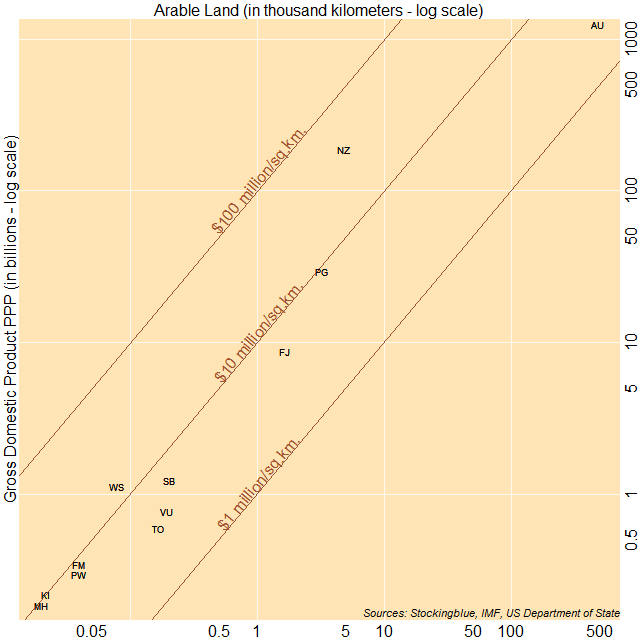
The chart above shows economic output as it relates to arable land. The countries to the top left have a larger ratio of gross domestic product (GDP) to arable land, while countries to the bottom right have a smaller ratio of GDP to arable land. New Zealand, Samoa, and Kiribati have the largest ratio of GDP to area whereas Australia, Tonga, and Vanuatu have the smallest ratio of GDP to area.
Findings
- No countries have a GDP per square kilometer of arable land of over 100 million international dollars or under one million international dollars.
- Australia has the smallest ratio of GDP to arable land with an economy of just over two million times that of its arable land in square kilometers.
- New Zealand has the largest ratio of GDP to arable land with an economy of over 38 million times that of its arable land in square kilometers.
- Only three countries make over 10 million international dollars per square kilometer of arable land.
Caveats
- Arable land may be a better attribute to use than total land area because it indicates where people are willing to live however, countries are likely to have resources beyond what can be found within their arable lands.
- American Samoa, Bouvet Island, Cook Islands, French Polynesia, French Southern Territories, Guam, Heard Island and McDonald Islands, Nauru, New Caledonia, Niue, Norfolk Island, Northern Mariana Islands, Pitcairn, Tokelau, Tuvalu, and Wallis and Futuna were missing data.
Details
New Zealand, Samoa, and Kiribati are the only countries on the continent that make over 10 million international dollars per square kilometer.
Papua New Guinea does pretty well for itself in this metric, as opposed to its usual abysmal performance.
Data
| Code | Country | Arable Land (square km) | GDP (in millions) | GDP Per Square Kilometer |
|---|---|---|---|---|
| AU | Australia | 479,954 | 1,251,416 | 2,607,366.54 |
| TO | Tonga | 166 | 597 | 3,596,385.54 |
| VU | Vanuatu | 195 | 772 | 3,958,974.36 |
| FJ | Fiji | 1,647 | 8,798 | 5,341,833.64 |
| SB | Solomon Islands | 202 | 1,247 | 6,173,267.33 |
| PW | Palau | 40 | 297 | 7,425,000 |
| FM | Micronesia | 40 | 345 | 8,625,000 |
| PG | Papua New Guinea | 3,240 | 29,481 | 9,099,074.07 |
| MH | Marshall Islands | 20 | 188 | 9,400,000 |
| KI | Kiribati | 22 | 222 | 10,090,909.09 |
| WS | Samoa | 79 | 1,129 | 14,291,139.24 |
| NZ | New Zealand | 4,838 | 186,476 | 38,544,026.46 |
Sources
US Department of State. 2017. "The World Factbook." Accessed September 21, 2017. https://www.cia.gov/library/publications/the-world-factbook/fields/2147.html.