EU and US Regions' Vacation Spending As Percent of Per Capita GDP in 2015
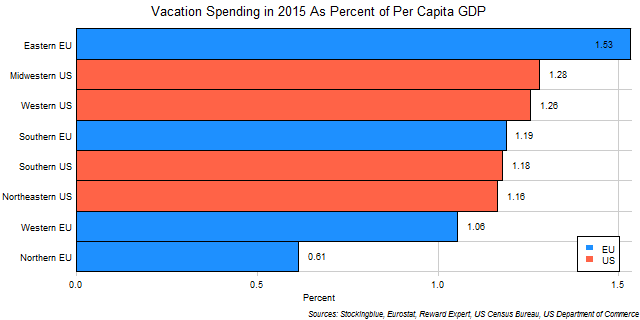
The chart above shows the average vacation expenditures for overnight stays by EU and US region as proportion of per capita GDP. There is a greater discrepancy in vacation spending between regions when per capita GDP is accounted for in the EU than there is in the US.
EU Regions' Vacation Spending As Percent of Per Capita GDP in 2015

The chart above shows the average vacation expenditures for overnight stays by EU region as proportion of per capita GDP. There is quite a disparity on vacation spending in EU regions with the Eastern EU spending more than twice as much of per capita GDP on vacations than the Northern EU.
US Regions' Vacation Spending As Percent of Per Capita GDP in 2015

The chart above shows the average vacation expenditures for overnight stays by US region as proportion of per capita GDP. All four US regions spend just above one percent of their per capita GDP on domestic travel.
EU and US Regions' Vacation Spending in 2015
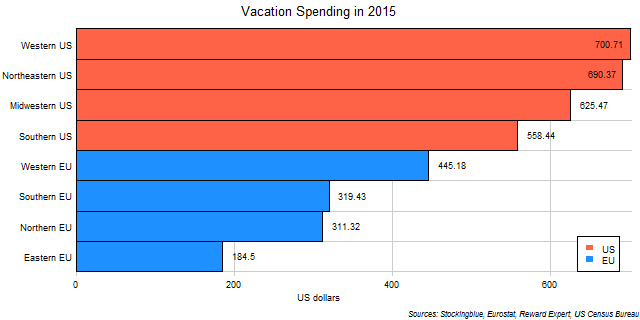
The chart above shows the average vacation expenditures for overnight stays by EU and US region in US dollars. All US regions spend more on vacations than any EU region does.
EU Regions' Vacation Spending in 2015

The chart above shows the average vacation expenditures for overnight stays by EU region. The Western EU is the region that spends the most on vacations by far.
US Regions' Vacation Spending in 2015

The chart above shows the average vacation expenditures for overnight stays by US region. The Western US slightly outspends the Northeastern US in vacation spending and is the only region that spends over $700 on vacations.
EU and US States' Vacation Spending As Percent of Per Capita GDP in 2015
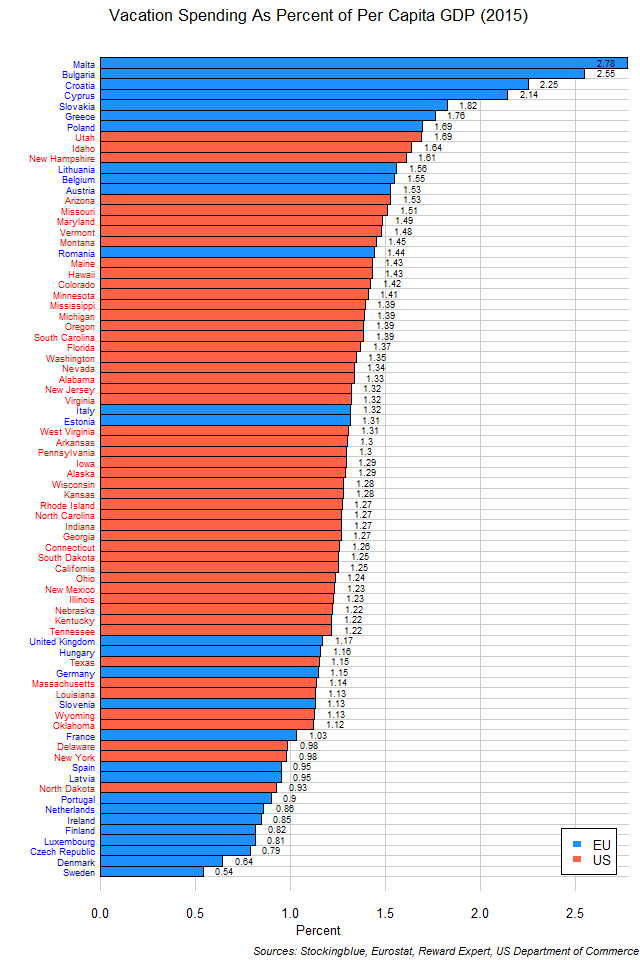
The chart above shows the average vacation expenditures for overnight stays by EU and US state as a proportion of per capita GDP. Americans are more uniform in their vacation spending than Europeans are whose vacation spending ranges from 0.5% of per capita GDP to nearly 3% of per capita GDP.
EU States' Vacation Spending As Percent of Per Capita GDP in 2015
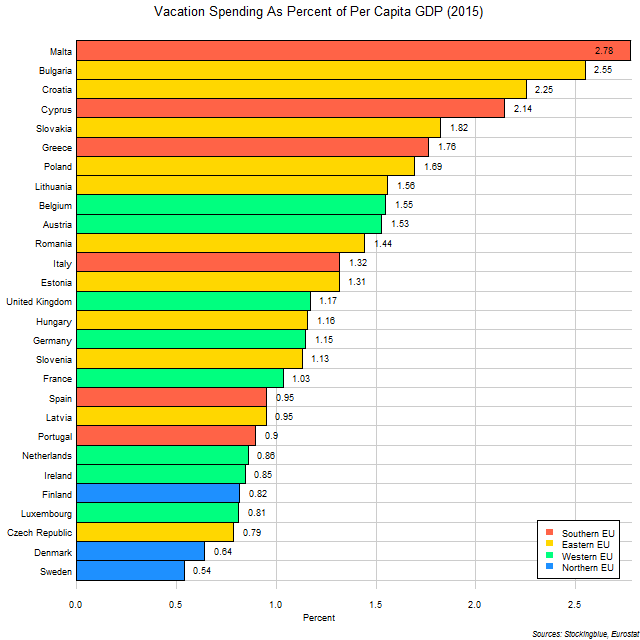
The chart above shows the average vacation expenditures for overnight stays by EU state as a proportion of per capita GDP. Eastern and Southern EU states spend a bigger portion of their personal wealth on vacations as the top eight states in this metric are all from those two regions.
US States' Vacation Spending As Percent of Per Capita GDP in 2015
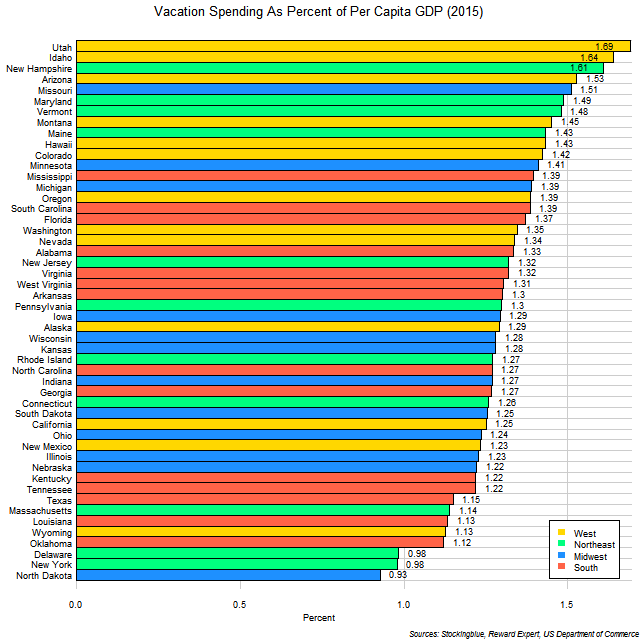
The chart above shows the average vacation expenditures for overnight stays by US state as a proportion of per capita GDP. Almost all states' vacationers spend somewhere around one or two percent of their per capita GDP on domestic vacations.
EU and US States' Vacation Spending in 2015
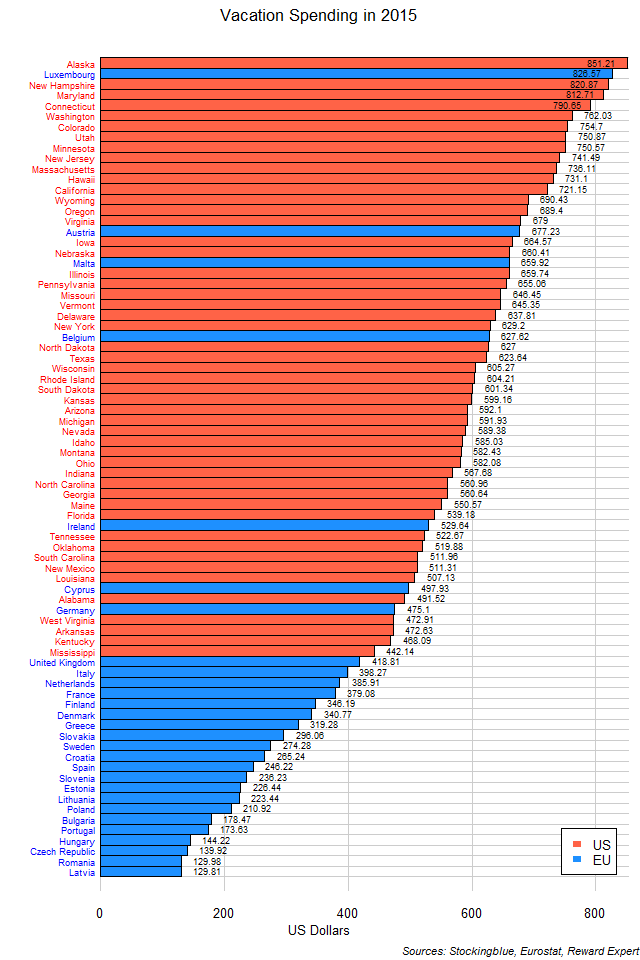
The chart above shows the average vacation expenditures for overnight stays by EU and US state in US dollars. As a whole, Americans spend more on their vacations than their European counterparts do.
Older