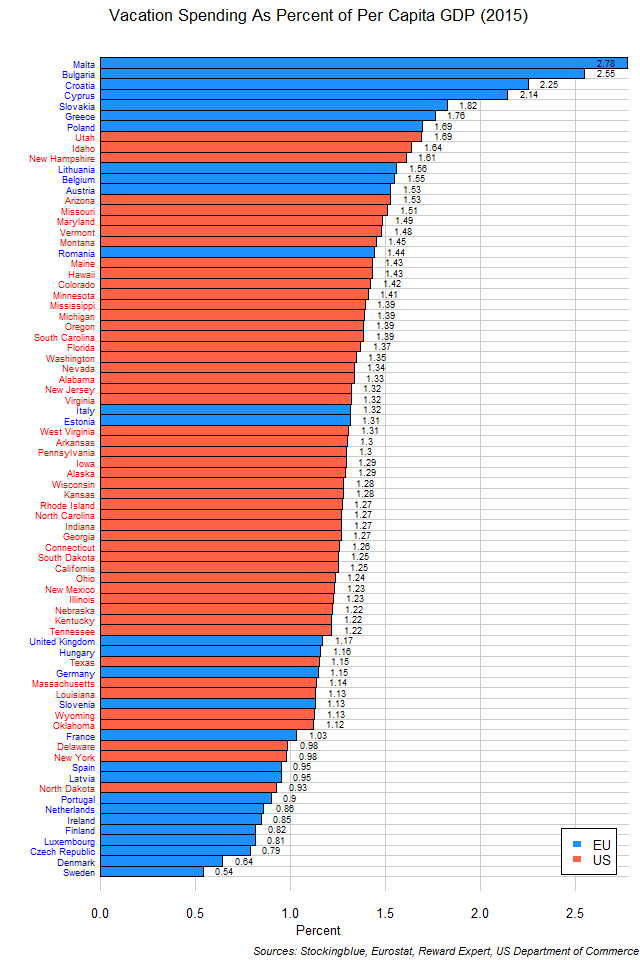
The chart above shows the average vacation expenditures for overnight stays by EU and US state as a proportion of per capita GDP. Americans are more uniform in their vacation spending than Europeans are whose vacation spending ranges from 0.5% of per capita GDP to nearly 3% of per capita GDP.
Findings
- The difference between the state with the greatest vacation spending as a proportion of per capita GDP, Malta, and the state with the least, Sweden, is 2.24 percentage points.
- Malta has 5.15 times the average vacation expenditures as percent of per capita GDP that Sweden does.
- The median proportion of per capita GDP spent on vacations for the 28 EU states is 1.16% and the mean is 1.34%.
- The median proportion of per capita GDP spent on vacations for the 50 US states is 1.30% and the mean is 1.31%.
- The median proportion of per capita GDP spent on vacations for the 78 EU and US states is 1.29% and the mean is 1.32%.
- US states' vacation spending ranges from 0.92% to 1.69% whereas EU states' vacation spending ranges from 0.54% to 2.78% of per capita GDP.
Caveats
- All figures are rounded to the nearest hundredth.
- United Kingdom data is from 2013, all other data is from 2015.
- US data is for domestic travel only whereas EU travel includes international. International travel spending for US states ranges from 5.21% for North Dakota to 9.50% for Utah.
- EU and US data come from different sources.
- EU data was converted from euros to dollars at the average 2015 0.90 euros to dollars rate.
Details
New Hampshire and Utah are the only states to be in the top ten of both total money spent on vacations and percentage of per capita GDP spent on vacations.
There is no statistically significant correlation between per capita GDP and proportion of per capita GDP spend on vacations for either EU or US states. The correlation for EU states between per capita GDP and percent of per capita GDP spend on vacations is -0.50 and for US states it is -0.51.
Sources
Eurostat. 2018. "Eurostat - Tables, Graphs and Maps Interface." Accessed August 2, 2018. http://appsso.eurostat.ec.europa.eu/nui/show.do?query=BOOKMARK_DS-420898_QID_-378D3319_UID_-3F171EB0&layout=TIME,C,X,0;GEO,L,Y,0;UNIT,L,Z,0;NA_ITEM,L,Z,1;INDICATORS,C,Z,2;&zSelection=DS-420898INDICATORS,OBS_FLAG;DS-420898UNIT,CP_EUR_HAB;DS-420898NA_ITEM,B1GQ;&rankName1=UNIT_1_2_-1_2&rankName2=INDICATORS_1_2_-1_2&rankName3=NA-ITEM_1_2_-1_2&rankName4=TIME_1_0_0_0&rankName5=GEO_1_2_0_1&sortC=ASC_-1_FIRST&rStp=&cStp=&rDCh=&cDCh=&rDM=true&cDM=true&footnes=false&empty=false&wai=false&time_mode=NONE&time_most_recent=false&lang=EN&cfo=%23%23%23%2C%23%23%23.%23%23%23.
Reward Expert. 2018. "Average Cost of Vacations by State." Accessed August 20, 2018. https://www.rewardexpert.com/blog/studies/average-cost-of-vacations-by-state/.
US Department of Commerce. 2018. "US Bureau of Economic Analysis." Accessed June 26, 2018. https://bea.gov/itable/iTable.cfm?ReqID=70&step=1#reqid=70&step=10&isuri=1&7003=1000&7035=-1&7004=naics&7005=1&7006=01000,02000,04000,05000,06000,08000,09000,10000,11000,12000,13000,15000,16000,17000,18000,19000,20000,21000,22000,23000,24000,25000,26000,27000,28000,29000,30000,31000,32000,33000,34000,35000,36000,37000,38000,39000,40000,41000,42000,44000,45000,46000,47000,48000,49000,50000,51000,53000,54000,55000,56000&7036=-1&7001=11000&7002=1&7090=70&7007=2017,2016,2015,2014,2013,2012,2011,2010,2009,2008,2007,2006&7093=levels.