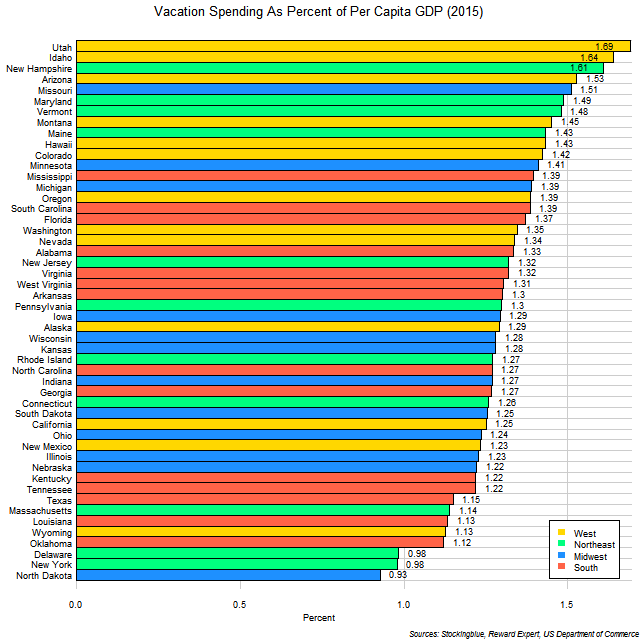
The chart above shows the average vacation expenditures for overnight stays by US state as a proportion of per capita GDP. Almost all states' vacationers spend somewhere around one or two percent of their per capita GDP on domestic vacations.
Findings
- The difference between the state with the greatest vacation spending as a proportion of per capita GDP, Utah, and the state with the least, North Dakota, is 0.76 percentage points.
- Utah has 1.82 times the average vacation expenditures as percent of per capita GDP that North Dakota does.
- The median proportion of per capita GDP spent on vacations for the 50 US states is 1.30% and the mean is 1.31%.
- All states residents' spend less than two percent of their per capita GDP on vacations.
Caveats
- The vacation spending data is for domestic travel only. International travel spending for US states ranges from $2,482.18 to $4,778.72.
Details
New Hampshire is the only state to be in the top five of both total dollars spent on vacations and percentage of per capita GDP spent on vacations.
Delaware, New York, and North Dakota are the only three states where residents spent less than one percent of their per capita GDP on vacations. They are also three of the four states with the highest per capita GDP.
Sources
Reward Expert. 2018. "Average Cost of Vacations by State." Accessed August 20, 2018. https://www.rewardexpert.com/blog/studies/average-cost-of-vacations-by-state/.
US Department of Commerce. 2018. "US Bureau of Economic Analysis." Accessed June 26, 2018. https://bea.gov/itable/iTable.cfm?ReqID=70&step=1#reqid=70&step=10&isuri=1&7003=1000&7035=-1&7004=naics&7005=1&7006=01000,02000,04000,05000,06000,08000,09000,10000,11000,12000,13000,15000,16000,17000,18000,19000,20000,21000,22000,23000,24000,25000,26000,27000,28000,29000,30000,31000,32000,33000,34000,35000,36000,37000,38000,39000,40000,41000,42000,44000,45000,46000,47000,48000,49000,50000,51000,53000,54000,55000,56000&7036=-1&7001=11000&7002=1&7090=70&7007=2017,2016,2015,2014,2013,2012,2011,2010,2009,2008,2007,2006&7093=levels.