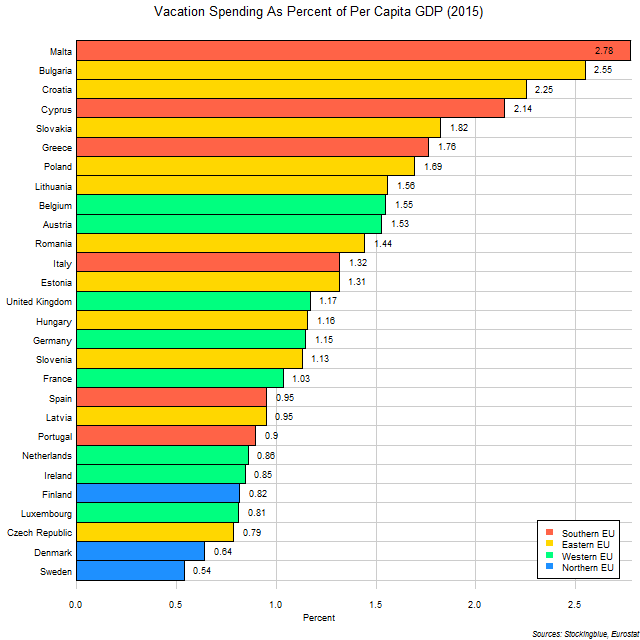
The chart above shows the average vacation expenditures for overnight stays by EU state as a proportion of per capita GDP. Eastern and Southern EU states spend a bigger portion of their personal wealth on vacations as the top eight states in this metric are all from those two regions.
Findings
- The difference between the state with the greatest vacation spending as a proportion of per capita GDP, Malta, and the state with the least, Sweden, is 2.24 percentage points.
- Malta has 5.15 times the average vacation expenditures as percent of per capita GDP that Sweden does.
- The median proportion of per capita GDP spent on vacations for the 28 EU states is 1.16% and the mean is 1.34%.
- Malta, Bulgaria, Croatia, and Cyprus are the only states that spend more than two percent of their per capita GDP on vacations.
Caveats
- All figures are rounded to the nearest hundredth.
- United Kingdom data is from 2013, all other data is from 2015.
Details
Malta and Cyprus are the only states to be in the top five of both total euros spent on vacations and percentage of per capita GDP spent on vacations.
Not one single Northern EU state spends more than one percent of per capita GDP on vacations. Every other region has at least four states that do so.
Sources
Eurostat. 2018. "Eurostat - Tables, Graphs and Maps Interface." Accessed August 2, 2018. http://appsso.eurostat.ec.europa.eu/nui/show.do?query=BOOKMARK_DS-420898_QID_-378D3319_UID_-3F171EB0&layout=TIME,C,X,0;GEO,L,Y,0;UNIT,L,Z,0;NA_ITEM,L,Z,1;INDICATORS,C,Z,2;&zSelection=DS-420898INDICATORS,OBS_FLAG;DS-420898UNIT,CP_EUR_HAB;DS-420898NA_ITEM,B1GQ;&rankName1=UNIT_1_2_-1_2&rankName2=INDICATORS_1_2_-1_2&rankName3=NA-ITEM_1_2_-1_2&rankName4=TIME_1_0_0_0&rankName5=GEO_1_2_0_1&sortC=ASC_-1_FIRST&rStp=&cStp=&rDCh=&cDCh=&rDM=true&cDM=true&footnes=false&empty=false&wai=false&time_mode=NONE&time_most_recent=false&lang=EN&cfo=%23%23%23%2C%23%23%23.%23%23%23.