EU Regional Unemployment Rates, March 2019

The chart above shows the unemployment rate in each EU region as of March 2019 (unless otherwise noted - see caveats below), the change from the previous month, and the rate one year prior. The Northern EU is the only region with an unemployment rate larger than the previous month as well as larger than last year.
EU and US Unemployment Rates, March 2019
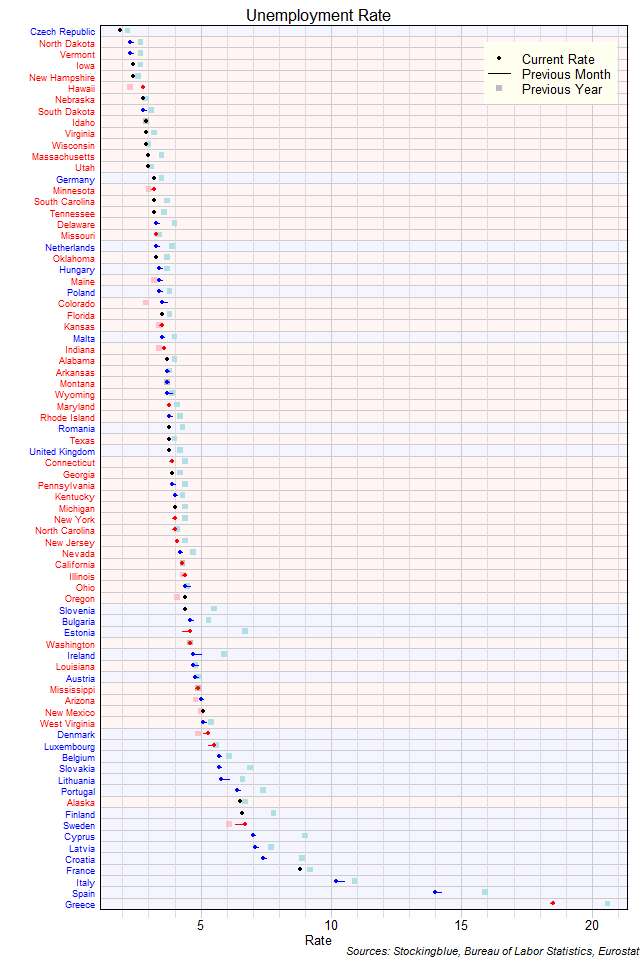
The chart above shows the unemployment rate in each EU and US state as of March 2019 (unless otherwise noted - see caveats below), the change from the previous month, and the rate one year prior. The Czech Republic continues to be the only state with an unemployment rate below two percent; it is also the only EU state with an unemployment rate below three percent. Ten US states have a rate below three percent.
EU Unemployment Rates, March 2019
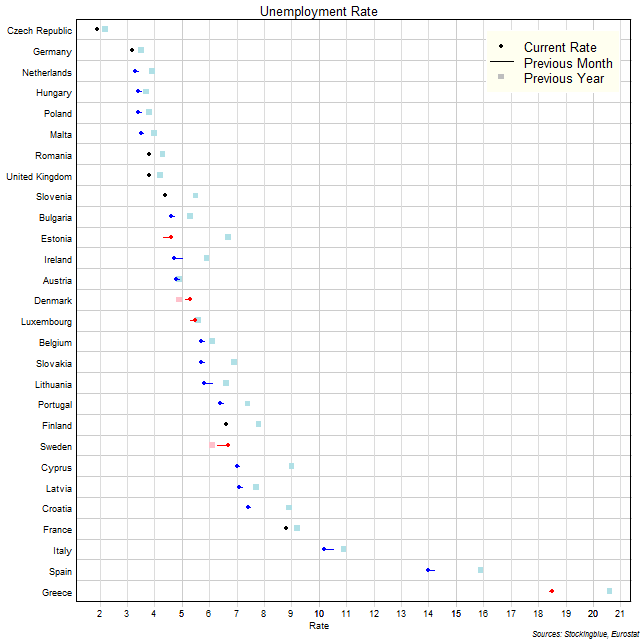
The chart above shows the unemployment rate in each EU state as of March 2019 (unless otherwise noted - see caveats below), the change from the previous month, and the rate one year prior. The Czech Republic continues to be the only state with an unemployment rate below three percent.
EU Regions by Annual Riders per Kilometer of Subway Track

The chart above shows the number of annual riders for every kilometer of track in each EU region. One million annual riders is the equivalent of 2,740 riders a day. The Eastern EU is the only region with over 4 million annual riders for every kilometer of subway track.
EU and US States by Annual Riders per Mile of Subway Track
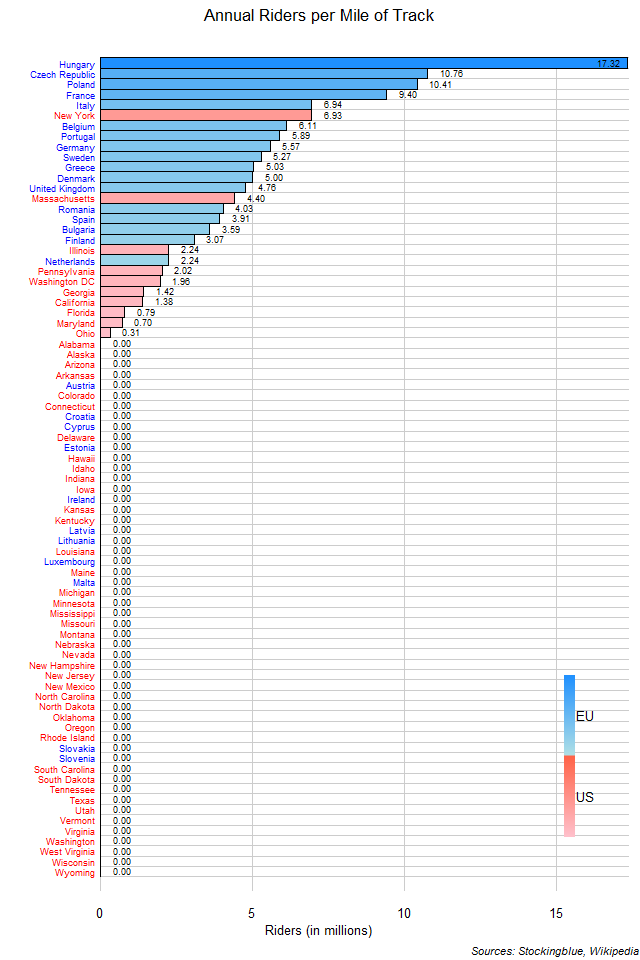
The chart above shows the number of annual riders for every mile of track in each state. One million annual riders is the equivalent of 2,740 riders a day. EU states tend to pack in more riders for every unit of track than US states do.
EU States by Annual Riders per Kilometer of Subway Track
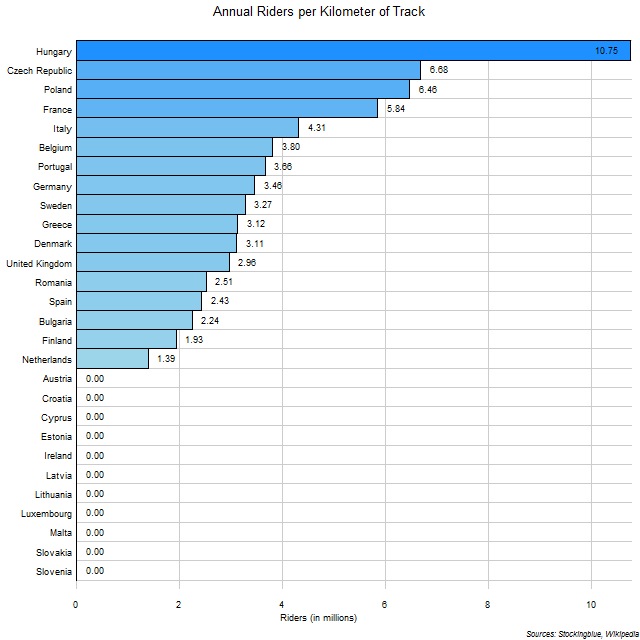
The chart above shows the number of annual riders for every kilometer of track in each state. One million annual riders is the equivalent of 2,740 riders a day. So the Netherlands has 3,808 daily riders for every kilometer of track while Hungary has 29,452.
EU Regions by Annual Riders per Subway Station

The chart above shows the number of annual riders for every subway station in each EU region. One million annual riders is the equivalent of 2,740 riders a day. The Eastern EU is in a class all its own.
EU States by Annual Riders per Subway Station
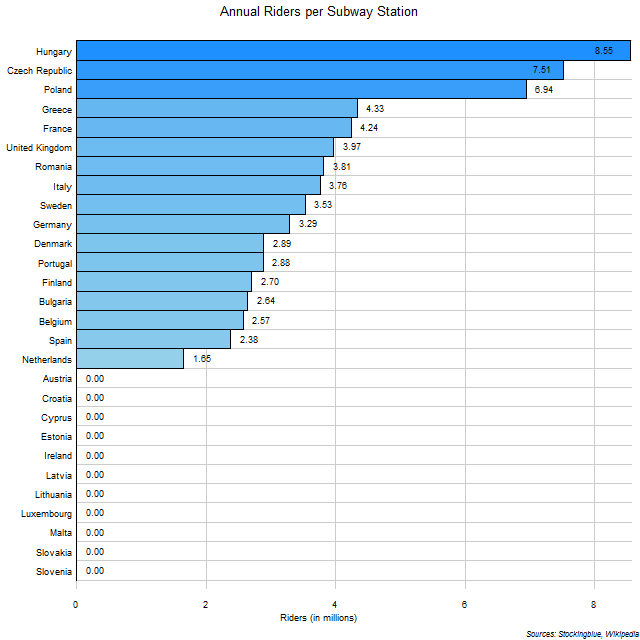
The chart above shows the number of annual riders for every subway station in each EU state. One million annual riders is the equivalent of 2,740 riders a day. So the Netherlands has 4,521 daily riders for every station while Hungary has 23,425.
EU and US Regional Unemployment Rates, February 2019
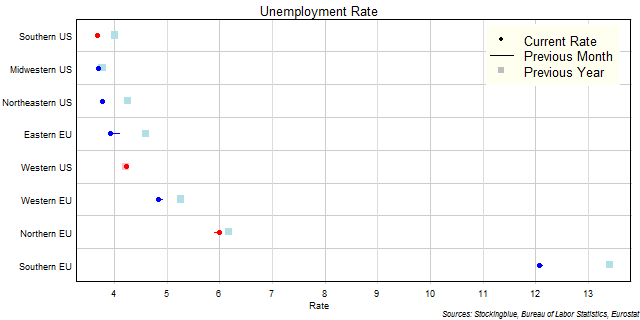
The chart above shows the unemployment rate in each EU and US region as of February 2019 (unless otherwise noted - see caveats below), the change from the previous month, and the rate one year prior. US regions fare considerably better in this metric than EU regions do.
EU Regional Unemployment Rates, February 2019

The chart above shows the unemployment rate in each EU region as of February 2019 (unless otherwise noted - see caveats below), the change from the previous month, and the rate one year prior. The Eastern EU continues to hold the lowest unemployment rate as it did last month and last year.
OlderNewer