Per Capita GDP by EU State, Fourth Quarter 2018
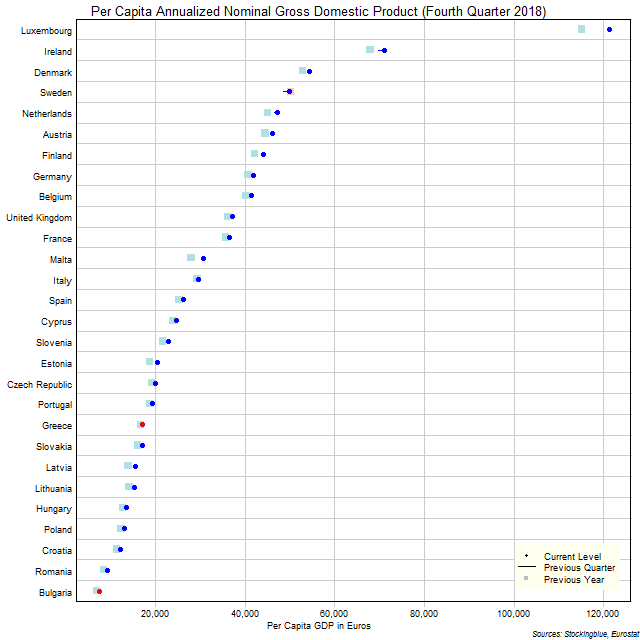
The chart above shows the per capita annualized nominal gross domestic product (GDP) in each EU state as of the fourth quarter of 2018 in euros, the change from the previous quarter, and the GDP one year prior. Luxembourg has at least double the per capita GDP of every other EU state save for Ireland.
EU and US GDP by Region, Fourth Quarter 2018
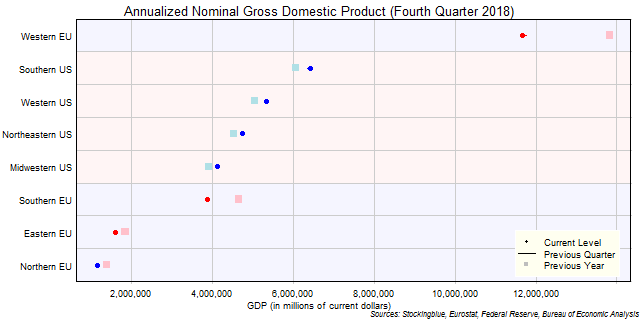
The chart above shows the annualized nominal gross domestic product (GDP) in each EU and US region as of the fourth quarter of 2018 in millions of dollars, the change from the previous quarter, and the GDP one year prior. The Western EU is the only EU region that has a larger GDP than any US region.
EU GDP by Region, Fourth Quarter 2018

The chart above shows the annualized nominal gross domestic product (GDP) in each EU region as of the fourth quarter of 2018 in millions of euros, the change from the previous quarter, and the GDP one year prior. Every single region's economy grew both over the past quarter and the past year.
EU and US GDP by State, Fourth Quarter 2018
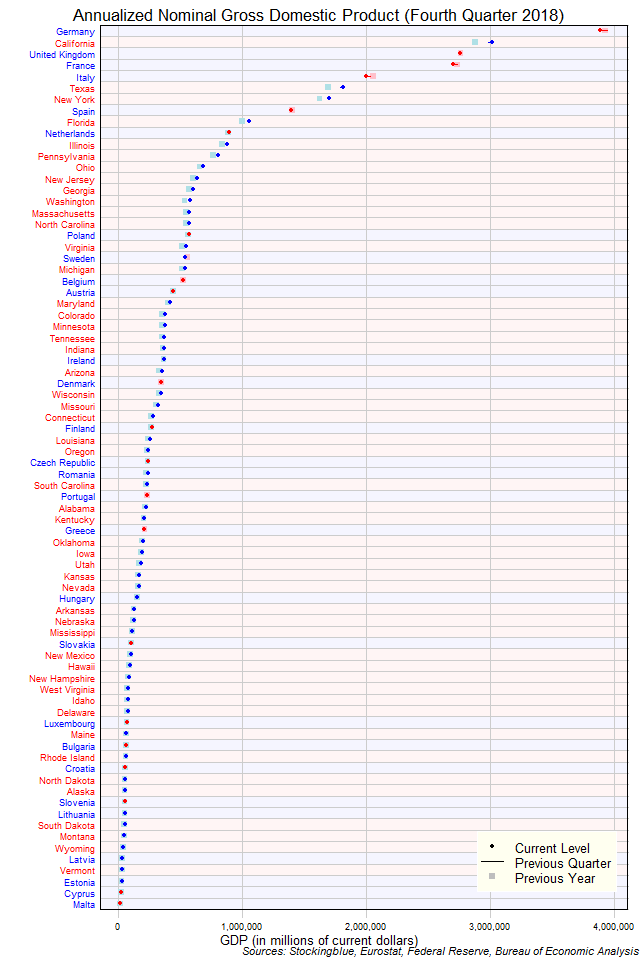
The chart above shows the annualized nominal gross domestic product (GDP) in each EU and US state as of the fourth quarter of 2018 in millions of US dollars, the change from the previous quarter, and the GDP one year prior. Only five states in both the EU and the US (four of which are from the EU) have an annualized GDP of over $2 trillion.
EU GDP by State, Fourth Quarter 2018
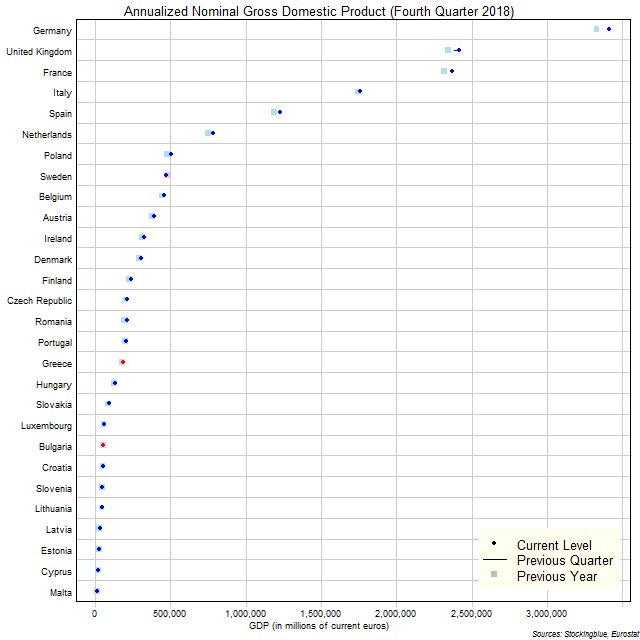
The chart above shows the annualized nominal gross domestic product (GDP) in each EU state as of the fourth quarter of 2018 in millions of euros, the change from the previous quarter, and the GDP one year prior. Germany is the only state with an annualized GDP of over €3 trillion.
EU and US Regional Crude Oil Production, January 2019
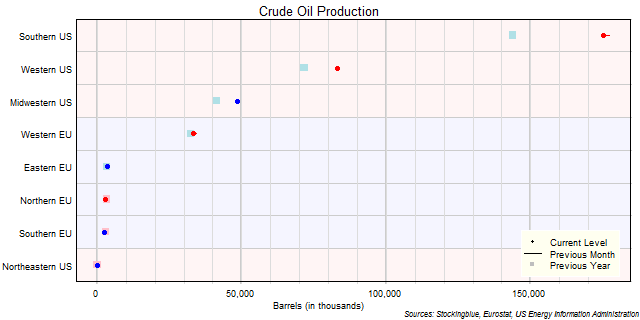
The chart above shows the crude oil production in each EU and US region as of January 2019 in thousands of barrels, the change from the previous month, and the production one year prior. The Northeast produces almost no crude at all.
EU Regional Crude Oil Production, January 2019

The chart above shows the crude oil production in each EU region as of January 2019 in thousands of metric tons, the change from the previous month, and the production one year prior. The Eastern EU surpassed the Northern EU in crude production.
EU and US Crude Oil Production, January 2019
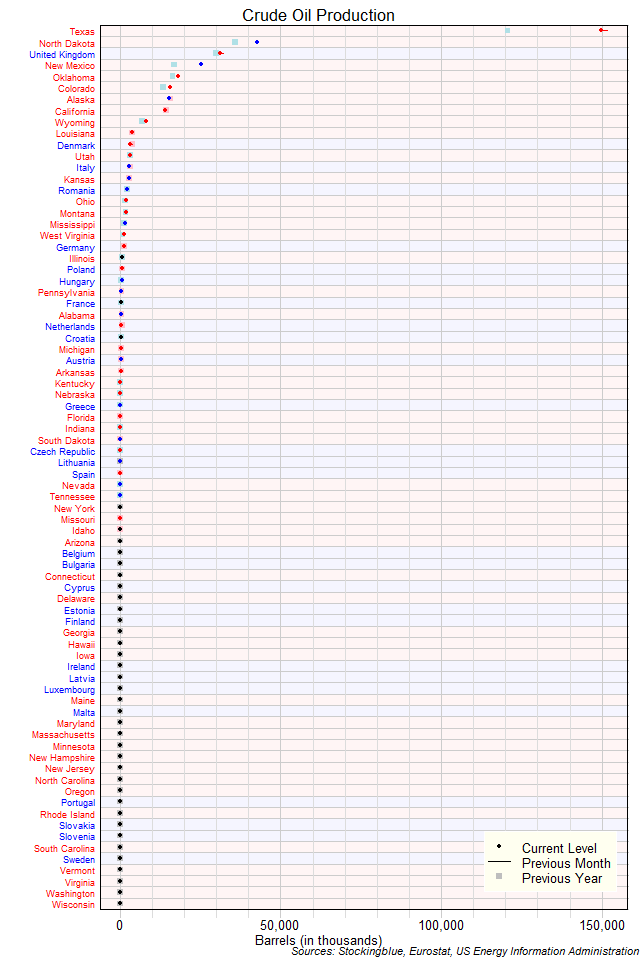
The chart above shows the crude oil production in each EU and US state as of January 2019 (unless otherwise noted - see caveats below) in thousands of barrels, the change from the previous month, and the production one year prior. Texas produces three times more crude oil than the entire EU combined.
EU Crude Oil Production, January 2019
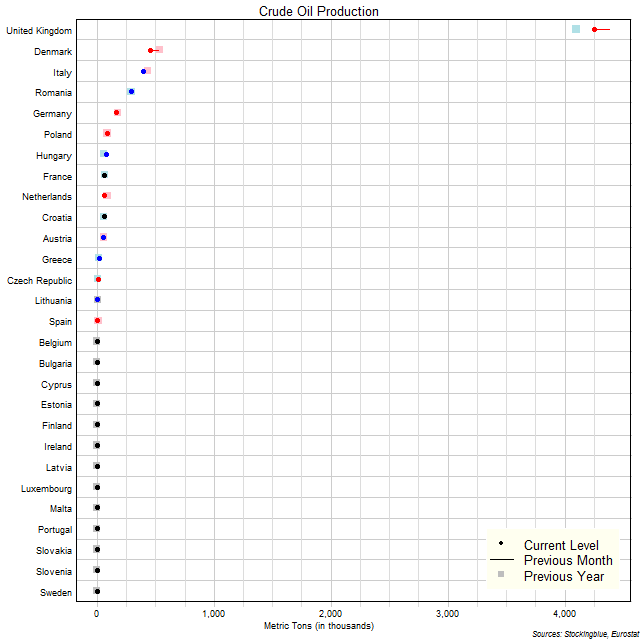
The chart above shows the crude oil production in each EU state as of January 2019 (unless otherwise noted - see caveats below) in thousands of metric tons, the change from the previous month, and the production one year prior. The United Kingdom dominates over the other states.
EU and US Regional Unemployment Rates, March 2019
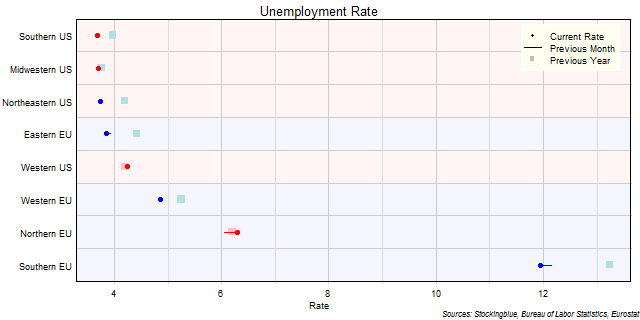
The chart above shows the unemployment rate in each EU and US region as of March 2019 (unless otherwise noted - see caveats below), the change from the previous month, and the rate one year prior. US regions continue to have considerably lower unemployment rates than EU regions.
OlderNewer