Per Capita GDP by EU and US State, Second Quarter 2019
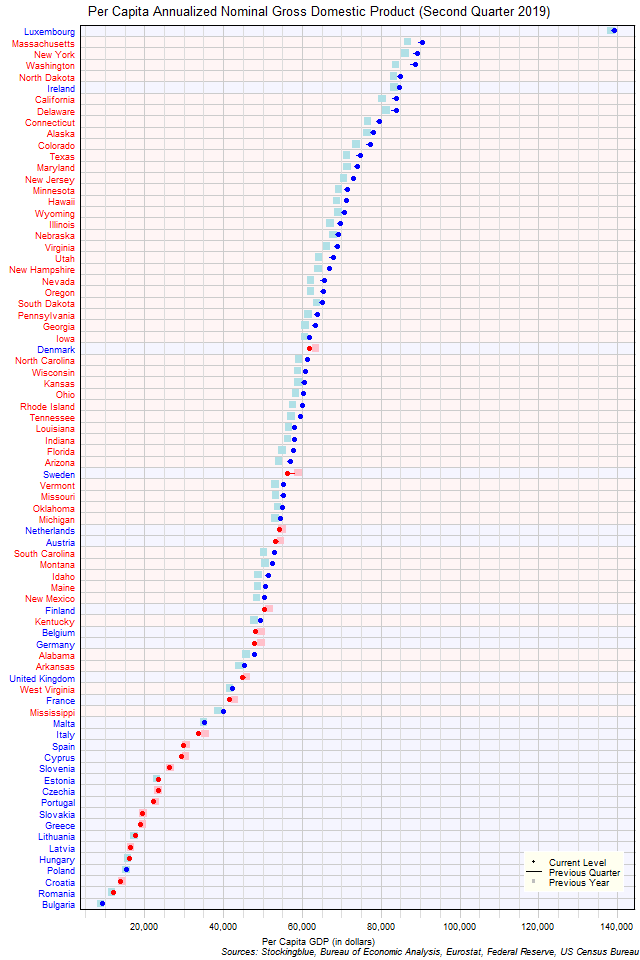
The chart above shows the per capita annualized nominal gross domestic product (GDP) in each EU and US state as of the second quarter of 2019 in dollars, the change from the previous quarter, and the GDP one year prior. Luxembourg is in a class all by itself.
Per Capita GDP by EU State, Second Quarter 2019
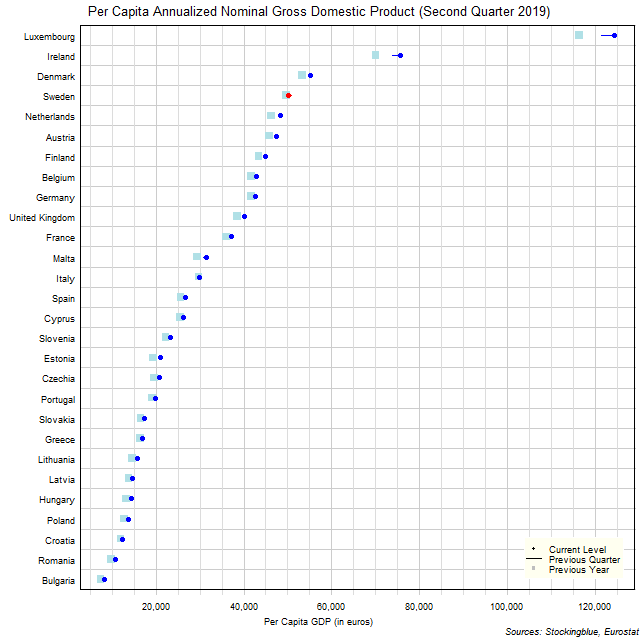
The chart above shows the per capita annualized nominal gross domestic product (GDP) in each EU state as of the second quarter of 2019 in euros, the change from the previous quarter, and the GDP one year prior. Sweden was the only state to see a drop in per capita GDP over the previous quarter.
EU and US GDP by Region, Second Quarter 2019
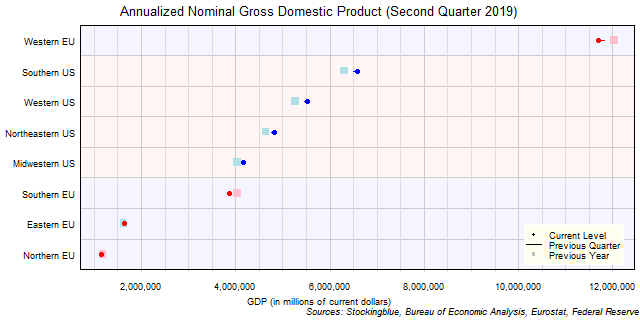
The chart above shows the annualized nominal gross domestic product (GDP) in each EU and US region as of the second quarter of 2019 in millions of dollars, the change from the previous quarter, and the GDP one year prior. The Western EU is the only EU region that has a larger GDP than any US region.
EU GDP by Region, Second Quarter 2019

The chart above shows the annualized nominal gross domestic product (GDP) in each EU region as of the second quarter of 2019 in millions of euros, the change from the previous quarter, and the GDP one year prior. Every single region's economy grew both over the past quarter and the past year.
EU and US GDP by State, Second Quarter 2019
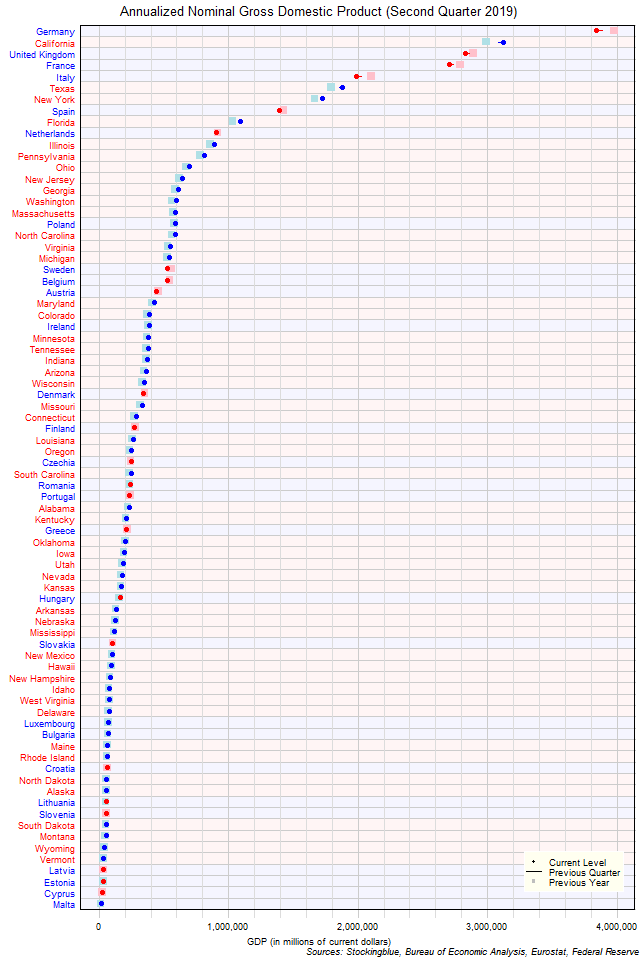
The chart above shows the annualized nominal gross domestic product (GDP) in each EU and US state as of the second quarter of 2019 in millions of US dollars, the change from the previous quarter, and the GDP one year prior. Only four states in both the EU and the US (three of which are from the EU) have an annualized GDP of over $2 trillion.
EU GDP by State, Second Quarter 2019
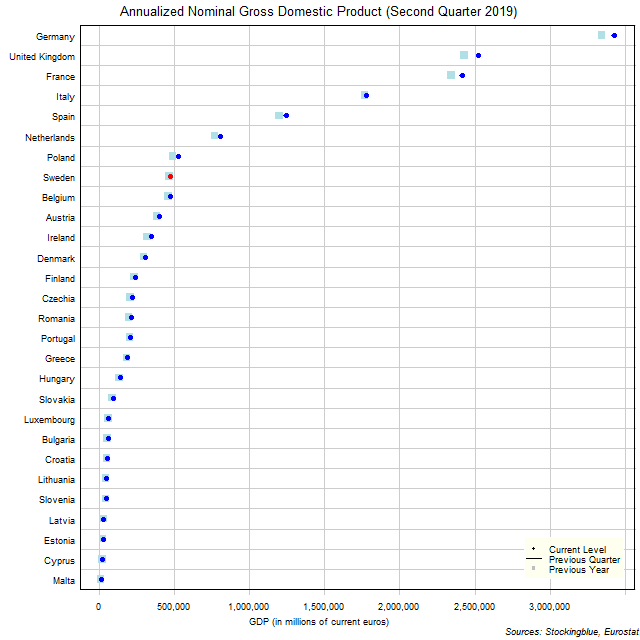
The chart above shows the annualized nominal gross domestic product (GDP) in each EU state as of the second quarter of 2019 in millions of euros, the change from the previous quarter, and the GDP one year prior. Sweden is the only state to see a drop from the previous quarter.
EU and US Regional Unemployment Rates, September 2019
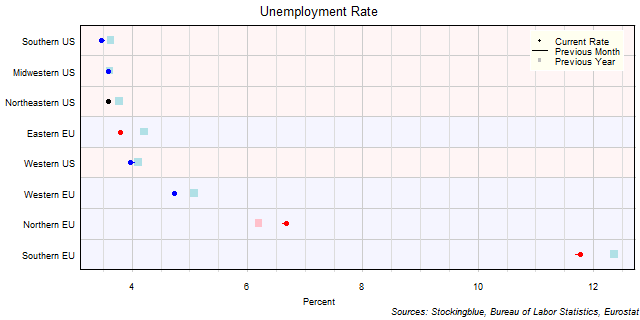
The chart above shows the unemployment rate in each EU and US region as of September 2019 (unless otherwise noted - see caveats below), the change from the previous month, and the rate one year prior. US regions continue to have considerably lower unemployment rates than EU regions with the Eastern EU being the only EU region that tops a US region.
EU Regional Unemployment Rates, September 2019

The chart above shows the unemployment rate in each EU region as of September 2019 (unless otherwise noted - see caveats below), the change from the previous month, and the rate one year prior. The Western EU is the only region with an unemployment rate smaller than the previous month and smaller than last year.
EU and US Unemployment Rates, September 2019
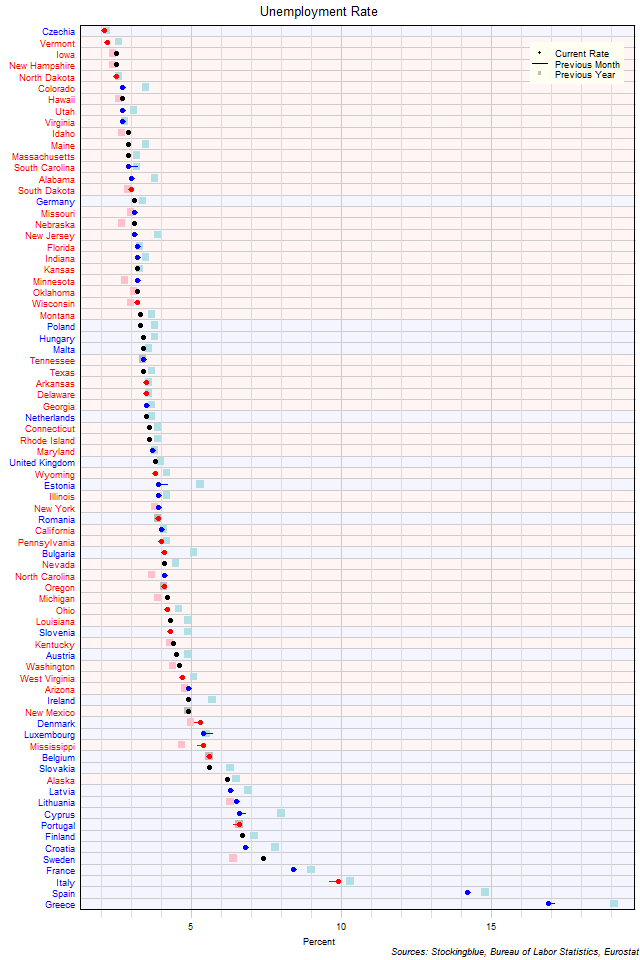
The chart above shows the unemployment rate in each EU and US state as of September 2019 (unless otherwise noted - see caveats below), the change from the previous month, and the rate one year prior. Czechia is the only EU state with an unemployment rate below three percent. Twelve US states have a rate below three percent.
EU Unemployment Rates, September 2019
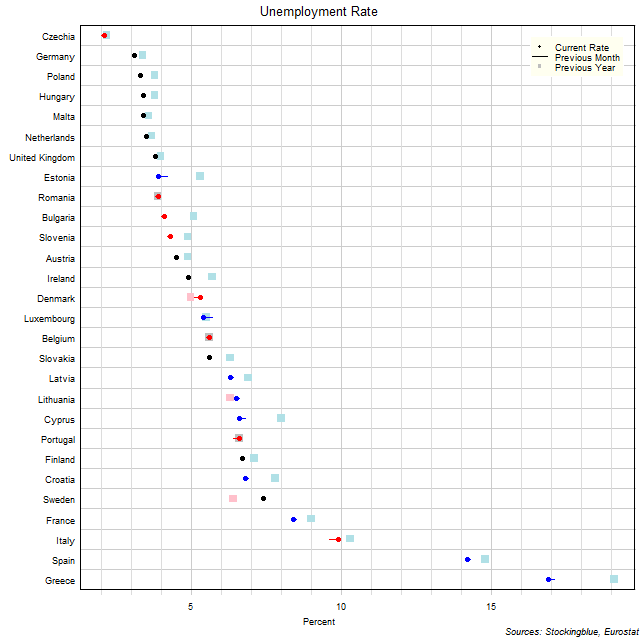
The chart above shows the unemployment rate in each EU state as of September 2019 (unless otherwise noted - see caveats below), the change from the previous month, and the rate one year prior. Czechia continues to be the only state with an unemployment rate below three percent.
OlderNewer