Miles of Roadway per Square Mile of Land in EU and US States
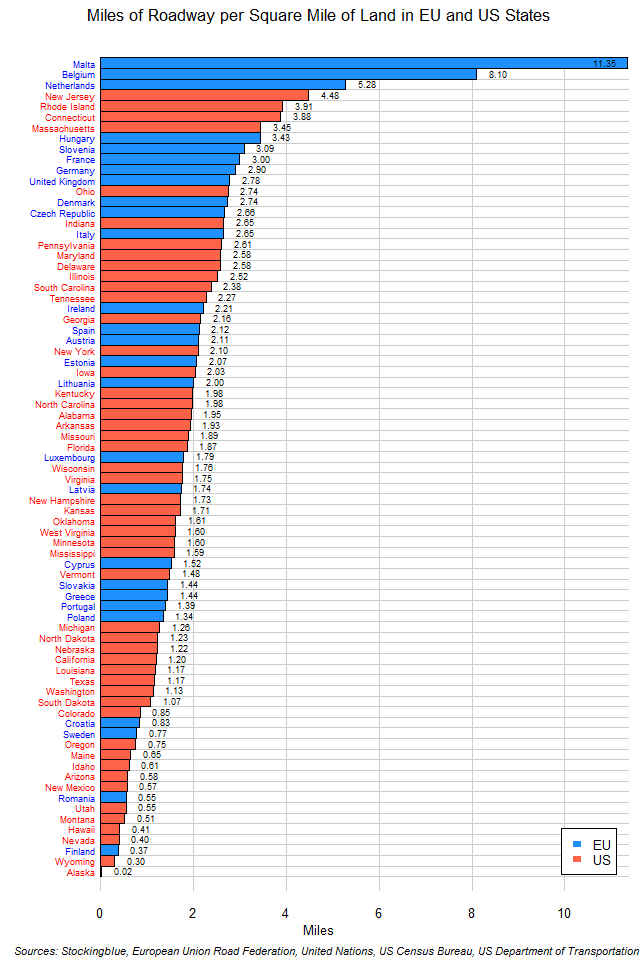
The chart above shows the miles of roads per square mile of land in EU and US states. New Jersey, which has the dubious distinction of being a series of roads connecting New York to Pennsylvania, is the most paved state in the US but even it is no match for the Netherlands, Belgium, and Malta which are the most paved states in both the EU and the US. Malta, which is essentially a city-state is the most paved having nearly three times as many roads relative to its territory as New Jersey has.
Road to Rail Ratios in EU and US Regions
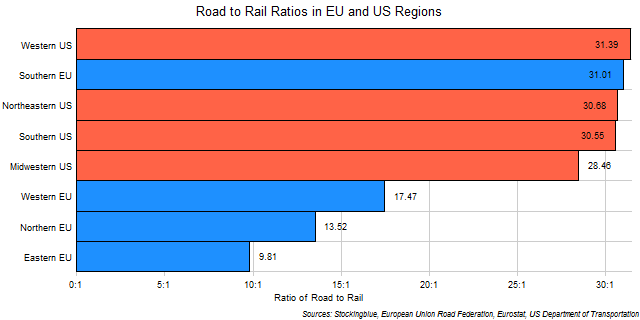
The chart above shows the ratio of the road network to the rail network in every EU and US region. The larger the ratio, the more prevalent roads are over rail in the region. For instance, the Eastern EU has nearly 10 times more kilometers of road for every kilometer of rail. Not surprisingly, all US regions have high road to rail ratios while only one EU region rivals them: the Southern EU.
Road to Rail Ratios in EU and US States
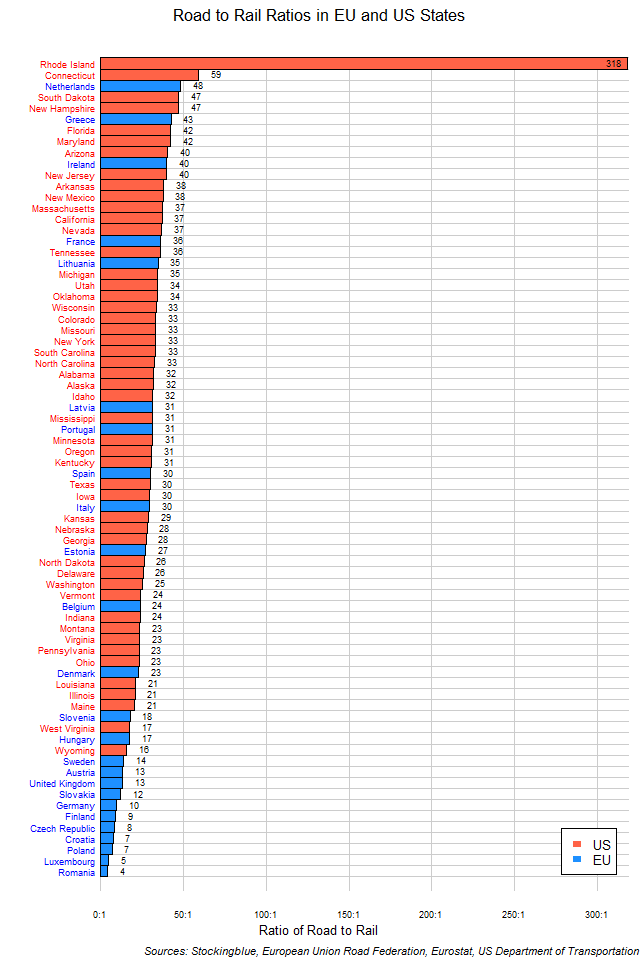
The chart above shows the ratio of the road network to the rail network in every EU and US state. The larger the ratio, the more prevalent roads are over rail in the state. For instance, the Netherlands has 48 more miles of road for every mile of rail. Only two states have a road network that is 50 times larger than their rail network and they are both located in the Northeastern US.
Vehicles per Mile of Roads in EU and US Regions
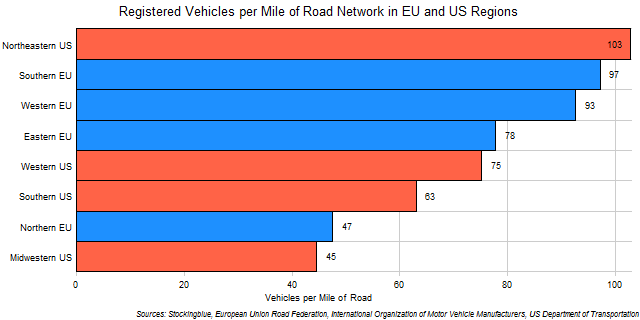
The chart above shows the number of motor vehicles in EU and US regions by mile of roads. With the exception of the Northeastern US and the Northern EU, the EU regions have a higher vehicle to road length ratio than the US regions do which is a very different result from the vehicles to residents ratio.
Vehicles per Mile of Roads in EU and US States
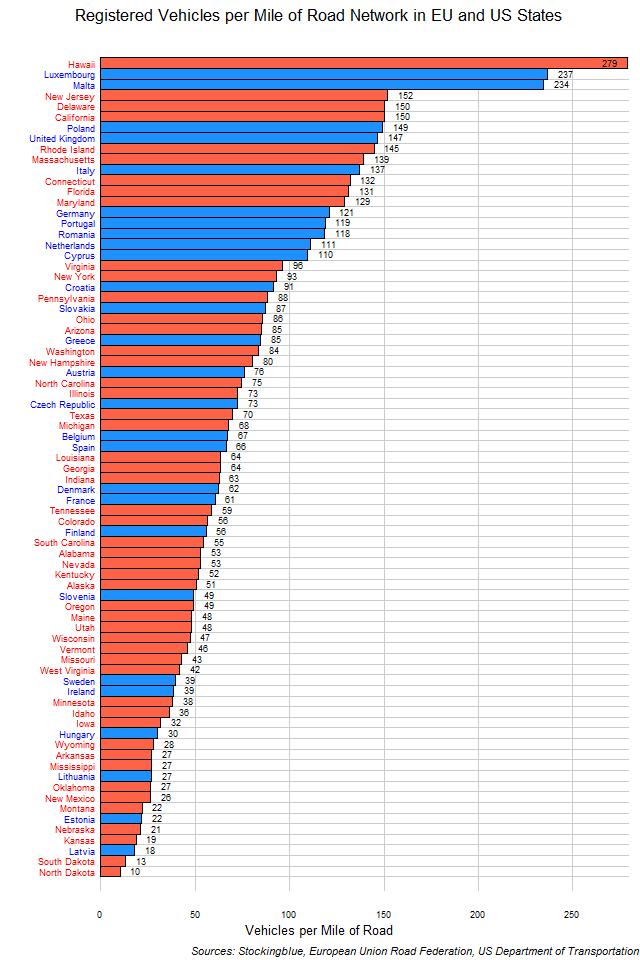
The chart above shows the number of motor vehicles in EU and US states by mile of roads. Some of the smallest states have the highest ratio of vehicles to roads but in the EU, small states also have some of the lowest ratios of vehicles to roads.
Vehicles per Thousand Inhabitants in EU and US Regions
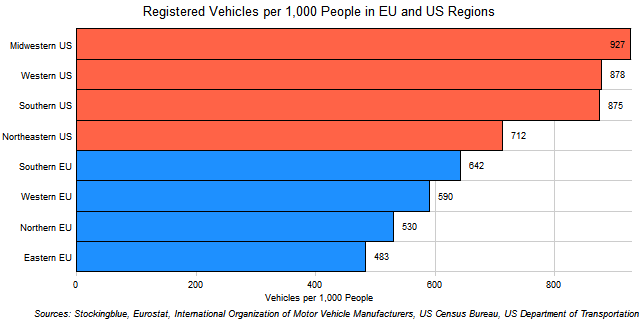
The chart above shows the rate of motor vehicle ownership in EU and US regions. No surprise here, every single American region has a higher vehicle ownership rate than any European region.
Vehicles per Thousand Inhabitants in the EU and US
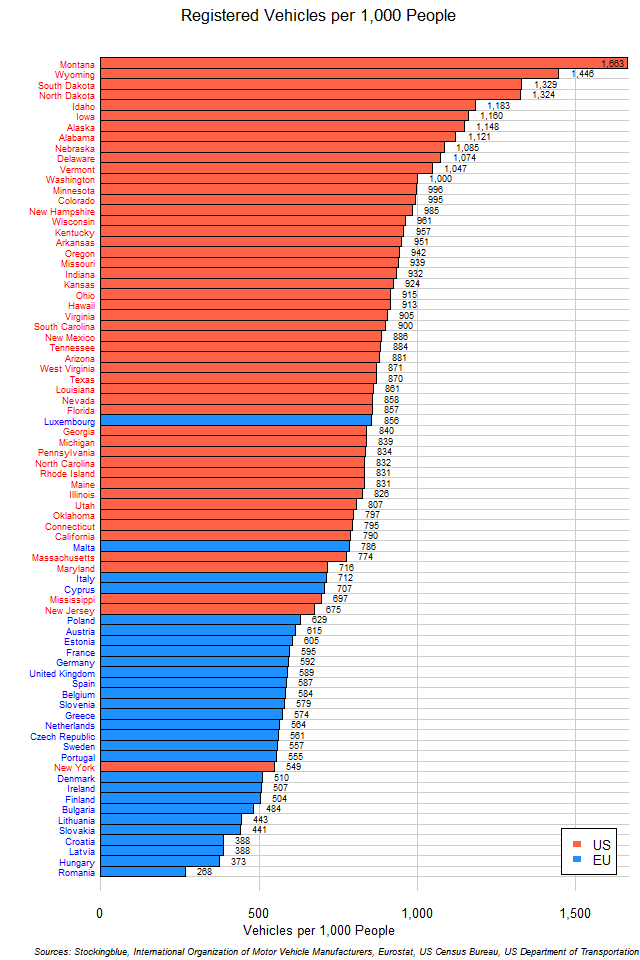
The chart above shows the rate of motor vehicle ownership in EU and US states. Clearly, Americans love motor vehicles more than Europeans do.
Vehicle Ownership in US and EU Regions
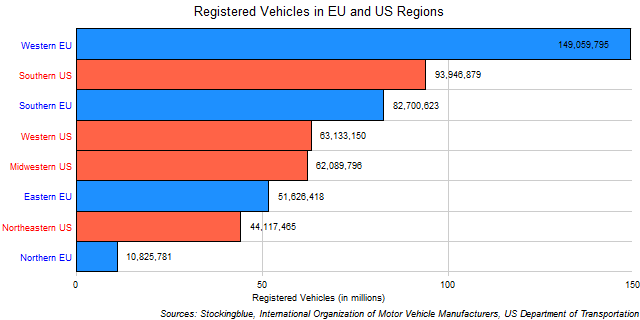
The chart above shows the total number of motor vehicles in US and EU regions. The Western EU has by far, the greatest number of registered vehicles in both the EU and the US.
Population of EU and US States Visualized
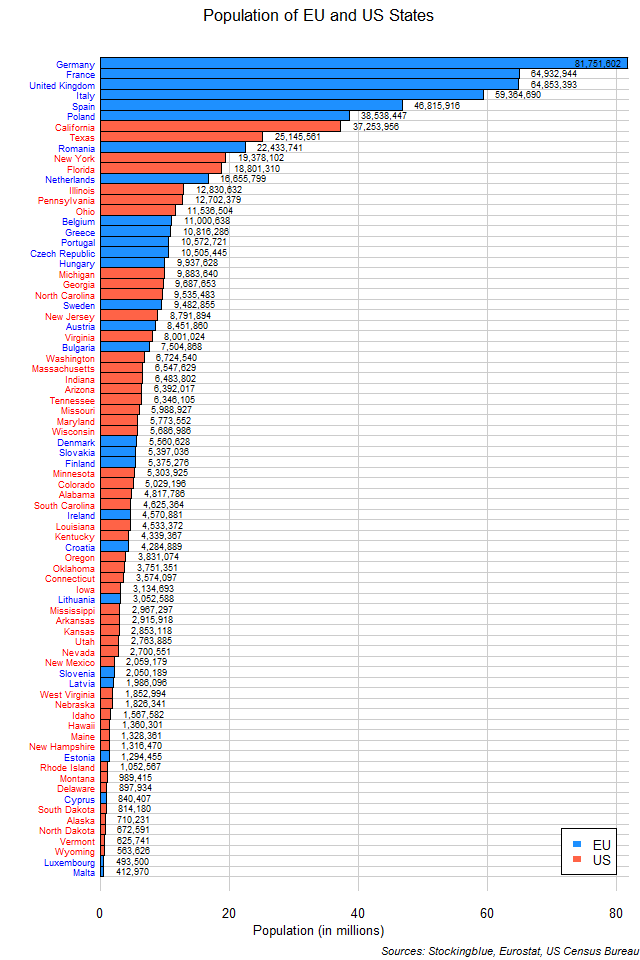
The chart above shows the population of EU and US states. The European Union has both the most and least populous states amongst the two superstates.
Vehicles in the United States and the European Union
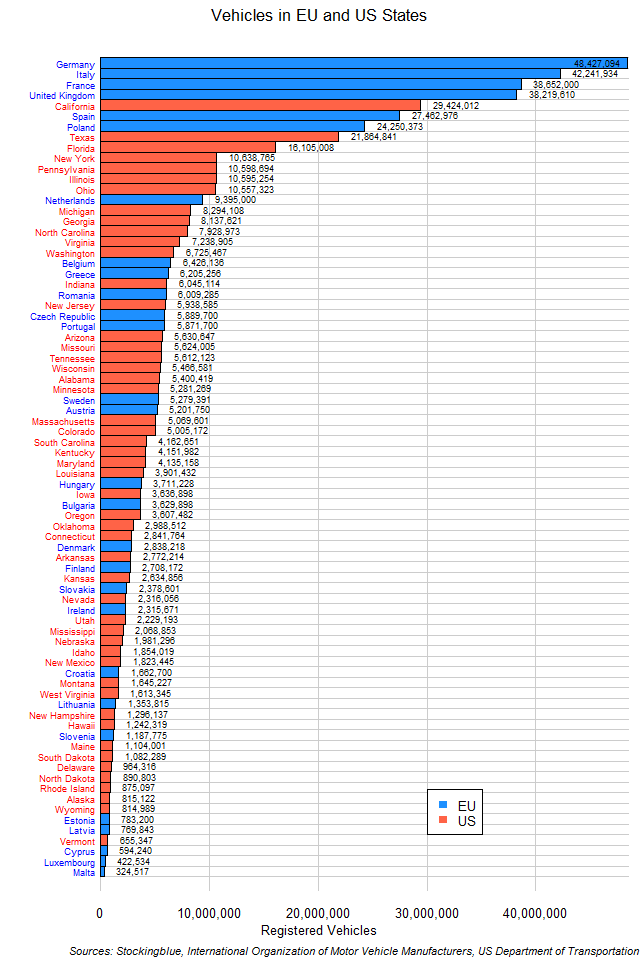
The chart above shows the total number of motor vehicles in EU and US states. The EU has the states with the most registered motor vehicles but also the states with the least registered motor vehicles.
OlderNewer