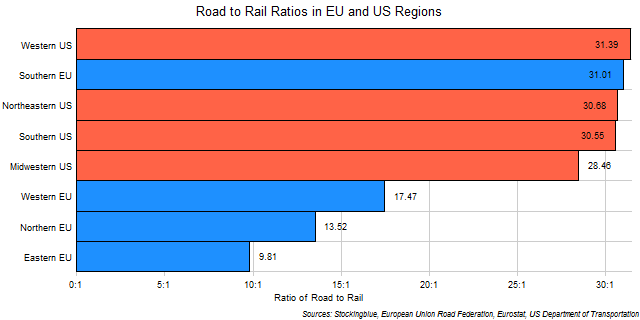
The chart above shows the ratio of the road network to the rail network in every EU and US region. The larger the ratio, the more prevalent roads are over rail in the region. For instance, the Eastern EU has nearly 10 times more kilometers of road for every kilometer of rail. Not surprisingly, all US regions have high road to rail ratios while only one EU region rivals them: the Southern EU.
Findings
- The difference between the region with the largest ratio, the Western US, and the region with the smallest ratio, the Eastern EU, is 21.57.
- The Western US has 3.2 times the road to rail ratio that the Eastern EU has.
- There really aren't any differences in the road to rail ratio between any of the US regions.
- Only one EU region has a higher ratio of road to rail than any US region.
Caveats
- US road and rail length data is from 2015.
- EU road length data is from 2008 except for Denmark which is from 2006, and Italy and Portugal which are from 2005.
- EU rail length data is from 2016 except for Belgium (2009), Denmark (1998), Greece (2015), the Netherlands (2003), Austria (2007), and Poland (2015).
- EU and US data come from different sources.
- Road and rail data come from different sources.
- Bulgaria is not included because it did not have complete data in the road data set.
- Cyprus, Malta, and Hawaii do not have rail networks.
- The Western US consists of California, Washington, Colorado, Arizona, Oregon, Utah, Nevada, New Mexico, Hawaii, Idaho, Alaska, Montana, and Wyoming.
- The Southern EU consists of Italy, Spain, Portugal, Greece, Cyprus, and Malta.
- The Northeastern US consists of New York, Pennsylvania, New Jersey, Massachusetts, Maryland, Connecticut, New Hampshire, Delaware, Maine, Rhode Island, and Vermont.
- The Southern US consists of Texas, Florida, Georgia, North Carolina, Virginia, Tennessee, Louisiana, South Carolina, Alabama, Kentucky, Oklahoma, Arkansas, Mississippi, and West Virginia.
- The Midwestern US consists of Illinois, Ohio, Michigan, Indiana, Minnesota, Wisconsin, Missouri, Iowa, Kansas, Nebraska, North Dakota, and South Dakota.
- The Western EU consists of Germany, United Kingdom, France, Netherlands, Belgium, Austria, Ireland, and Luxembourg.
- The Northern EU consists of Sweden, Denmark, and Finland.
- The Eastern EU consists of Poland, Czech Republic, Romania, Hungary, Slovakia, Bulgaria (not included), Croatia, Slovenia, Lithuania, Latvia, and Estonia.
Details
All four US regions have relatively similar road to rail ratios whereas the EU regions have a much wider disparity in their ratios between the regions. The US region with the highest ratio is only 1.1 times larger than the US region with the lowest ratio. In the EU, the Southern EU has a ratio that is over three times larger than the Eastern EU's. One wonders what effect this has on the economic disparity of the EU regions.
The ratio for the entire European Union (except for Bulgaria which is missing data) is 16.59 kilometers of road for every kilometer of rail which ranks the EU as a whole just under the Western EU and above the Northern EU. The ratio for the entire United States is 29.99 kilometers of road for every kilometer of rail which ranks the US as a whole just under the Southern US and just above the Midwestern US.
Sources
European Union Road Federation. 2011. "European Road Statistics 2011." Accessed March 12, 2018. http://www.irfnet.eu/images/stories/Statistics/2011/ERF-2011-STATS.pdf.
Eurostat. 2018. "Eurostat - Data Explorer: Railway Transport - Length of Tracks." Accessed March 20, 2018. http://appsso.eurostat.ec.europa.eu/nui/submitViewTableAction.do.
United States Department of Transportation. 2016. "Table HM-10M - Highway Statistics 2015 - Policy | Federal Highway Administration." Accessed March 12, 2018. https://www.fhwa.dot.gov/policyinformation/statistics/2015/hm10m.cfm.
United States Department of Transportation. 2018. "Table MV-1 - Highway Statistics 2015." Accessed February 20, 2018. https://www.fhwa.dot.gov/policyinformation/statistics/2015/mv1.cfm.