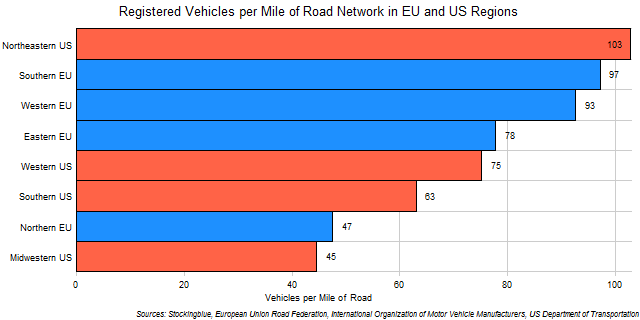
The chart above shows the number of motor vehicles in EU and US regions by mile of roads. With the exception of the Northeastern US and the Northern EU, the EU regions have a higher vehicle to road length ratio than the US regions do which is a very different result from the vehicles to residents ratio.
Findings
- The difference between the region with the most vehicles per mile, the Northeastern US, and the region with the least, the Midwestern US, is 58 vehicles per mile of road (36 vehicles per kilometer of road).
- The Northeastern US has 2.31 times the number of vehicles per unit of road that the Midwestern US does.
- Only the Northeastern US has at least 100 vehicles per mile of road (62 vehicles per kilometer of road).
Caveats
- EU and US ownership data is from 2015.
- EU road length data is from 2008 except for Denmark which is from 2006, and Italy and Portugal which are from 2005. US road length data is from 2015.
- EU and US data come from different sources.
- Ownership and road length data come from different sources.
- Total vehicles include automobiles, taxis, buses, trucks, and motorcycles of both public and private use.
- Bulgaria is not included because it did not have complete data in the road data set.
- The Northeastern US consists of New York, Pennsylvania, New Jersey, Massachusetts, Maryland, Connecticut, New Hampshire, Delaware, Maine, Rhode Island, and Vermont.
- The Southern EU consists of Italy, Spain, Portugal, Greece, Cyprus, and Malta.
- The Western EU consists of Germany, United Kingdom, France, Netherlands, Belgium, Austria, Ireland, and Luxembourg.
- The Eastern EU consists of Poland, Czech Republic, Romania, Hungary, Slovakia, Bulgaria (not included), Croatia, Slovenia, Lithuania, Latvia, and Estonia.
- The Western US consists of California, Washington, Colorado, Arizona, Oregon, Utah, Nevada, New Mexico, Hawaii, Idaho, Alaska, Montana, and Wyoming.
- The Southern US consists of Texas, Florida, Georgia, North Carolina, Virginia, Tennessee, Louisiana, South Carolina, Alabama, Kentucky, Oklahoma, Arkansas, Mississippi, and West Virginia.
- The Northern EU consists of Sweden, Denmark, and Finland.
- The Midwestern US consists of Illinois, Ohio, Michigan, Indiana, Minnesota, Wisconsin, Missouri, Iowa, Kansas, Nebraska, North Dakota, and South Dakota.
Details
It is interesting that the US regions dominate in the vehicles to residents ratio but fare poorly when vehicles are compared to length of roadway. This could be related to population density and this metric of vehicles per length of road correlates pretty closely with population density. Regions that have a low population density tend to have a vehicle to road network ratio which could be because there are too many roads built in sparsely populated places in order to ensure that everyone has access to roads. The only region that deviates from the correlation is the Western US and that could be due to the fact that Alaska does not have a rich roadway network and travel between places tends to be by bush plane rather than by motor vehicles.
The rate for the entire European Union is 88 vehicles per mile of road (55 vehicles per kilometer of road) which ranks the EU as a whole just under the Western EU and above the Eastern EU. The rate for the entire United States is 63 vehicles per mile of road (39 vehicles per kilometer of road) which ranks the US as a whole just under the Western US, above the Northern EU, and tied with the Southern US.
Sources
European Union Road Federation. 2011. "European Road Statistics 2011." Accessed March 12, 2018. http://www.irfnet.eu/images/stories/Statistics/2011/ERF-2011-STATS.pdf.
International Organization of Motor Vehicle Manufacturers. 2018. "Vehicles in Use - OICA." Accessed January 20, 2018. http://www.oica.net/category/vehicles-in-use/.
United States Department of Transportation. 2016. "Table HM-10M - Highway Statistics 2015 - Policy | Federal Highway Administration." Accessed March 12, 2018. https://www.fhwa.dot.gov/policyinformation/statistics/2015/hm10m.cfm.
United States Department of Transportation. 2018. "Table MV-1 - Highway Statistics 2015." Accessed February 20, 2018. https://www.fhwa.dot.gov/policyinformation/statistics/2015/mv1.cfm.