EU and US GDP by State, Fourth Quarter 2018
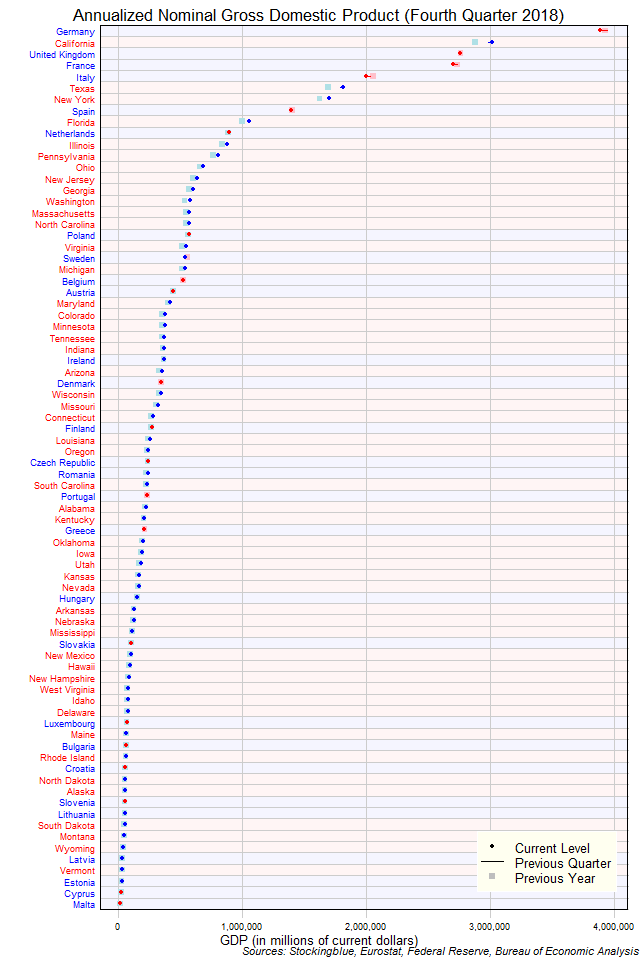
The chart above shows the annualized nominal gross domestic product (GDP) in each EU and US state as of the fourth quarter of 2018 in millions of US dollars, the change from the previous quarter, and the GDP one year prior. Only five states in both the EU and the US (four of which are from the EU) have an annualized GDP of over $2 trillion.
EU and US Regional Crude Oil Production, January 2019
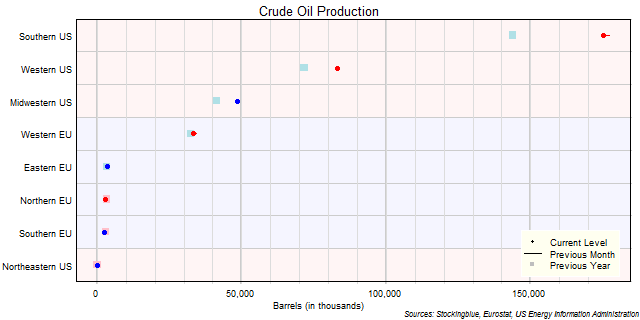
The chart above shows the crude oil production in each EU and US region as of January 2019 in thousands of barrels, the change from the previous month, and the production one year prior. The Northeast produces almost no crude at all.
EU and US Crude Oil Production, January 2019
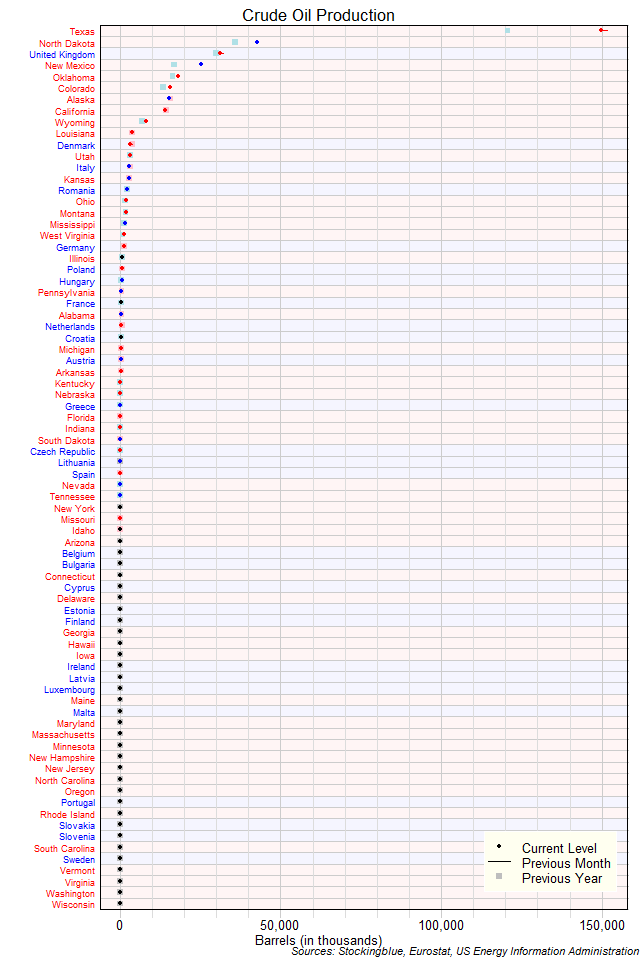
The chart above shows the crude oil production in each EU and US state as of January 2019 (unless otherwise noted - see caveats below) in thousands of barrels, the change from the previous month, and the production one year prior. Texas produces three times more crude oil than the entire EU combined.
EU and US Regional Unemployment Rates, March 2019
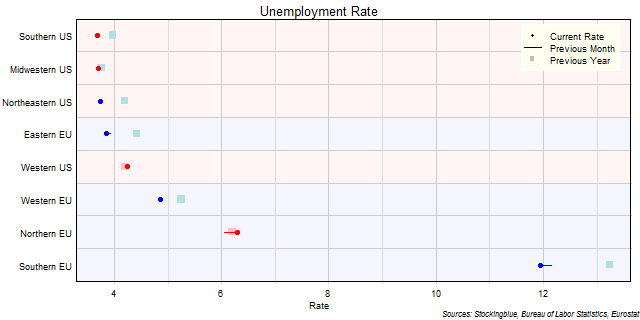
The chart above shows the unemployment rate in each EU and US region as of March 2019 (unless otherwise noted - see caveats below), the change from the previous month, and the rate one year prior. US regions continue to have considerably lower unemployment rates than EU regions.
EU and US Unemployment Rates, March 2019
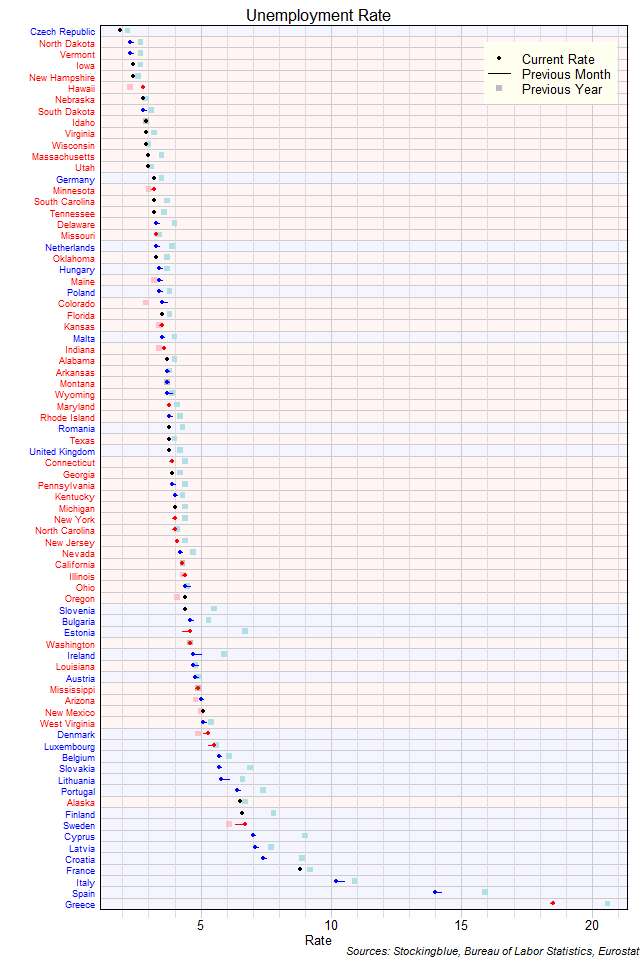
The chart above shows the unemployment rate in each EU and US state as of March 2019 (unless otherwise noted - see caveats below), the change from the previous month, and the rate one year prior. The Czech Republic continues to be the only state with an unemployment rate below two percent; it is also the only EU state with an unemployment rate below three percent. Ten US states have a rate below three percent.
EU and US Regions by Annual Riders per Mile of Subway Track
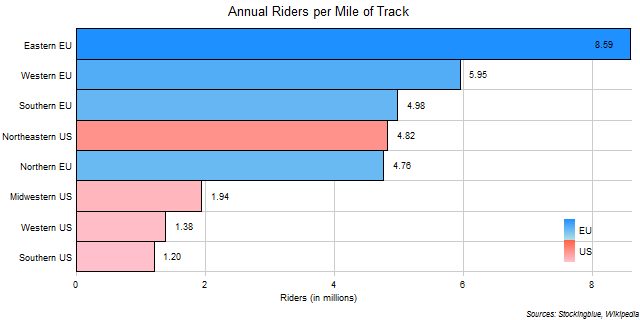
The chart above shows the number of annual riders for every mile of track in each EU and US region. One million annual riders is the equivalent of 2,740 riders a day. EU regions dominate in this metric.
EU and US States by Annual Riders per Mile of Subway Track
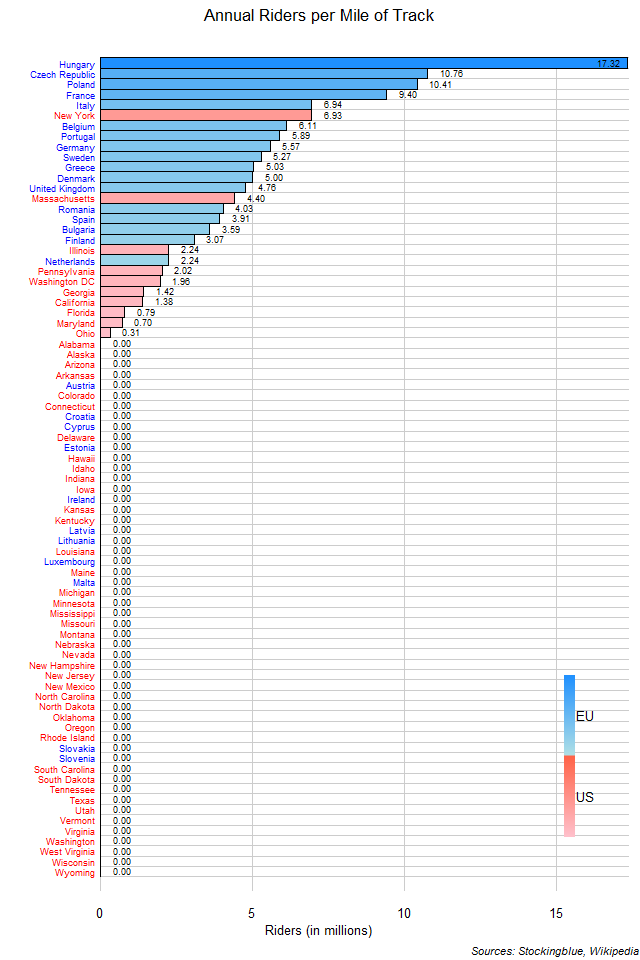
The chart above shows the number of annual riders for every mile of track in each state. One million annual riders is the equivalent of 2,740 riders a day. EU states tend to pack in more riders for every unit of track than US states do.
EU and US Regions by Annual Riders per Subway Station
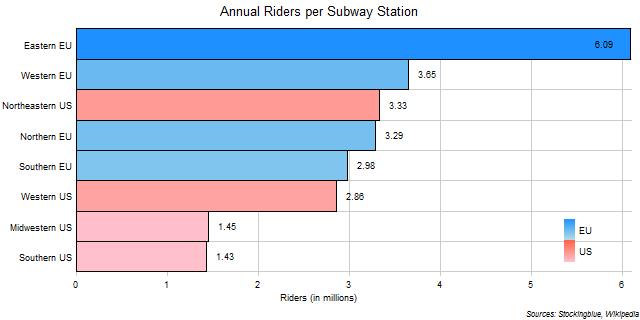
The chart above shows the number of annual riders for every subway station in each EU and US region. One million annual riders is the equivalent of 2,740 riders a day. The Eastern EU dominates all other regions.
EU and US States by Annual Riders per Subway Station
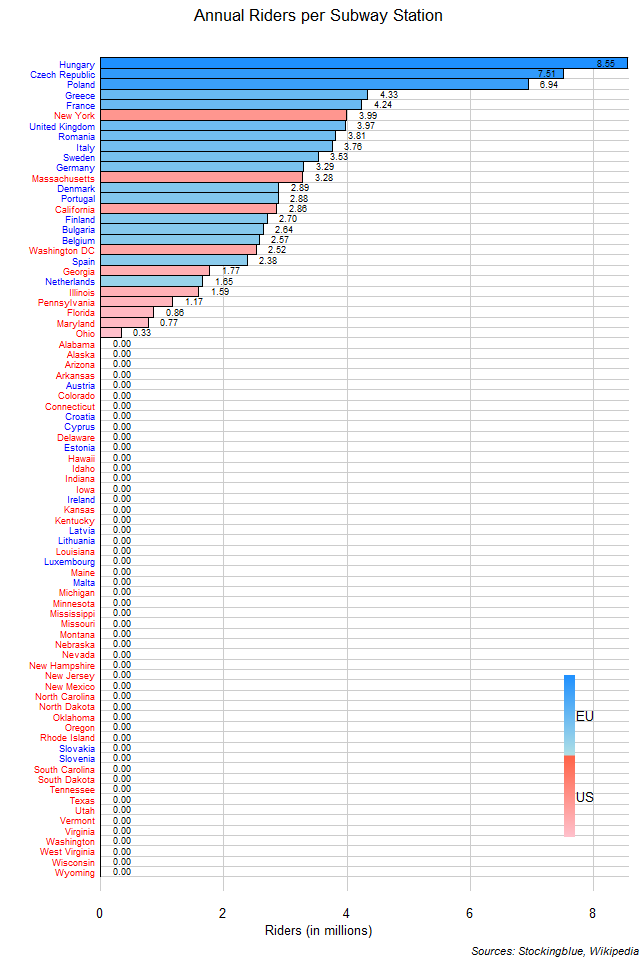
The chart above shows the number of annual riders for every subway station in each EU and US state. One million annual riders is the equivalent of 2,740 riders a day. So Ohio has 904 daily riders for every station while Hungary has 23,425.
EU and US Regional Unemployment Rates, February 2019
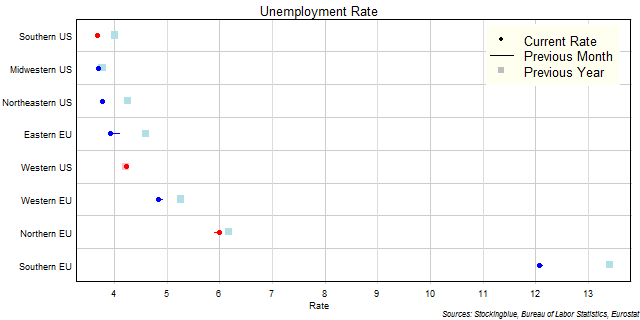
The chart above shows the unemployment rate in each EU and US region as of February 2019 (unless otherwise noted - see caveats below), the change from the previous month, and the rate one year prior. US regions fare considerably better in this metric than EU regions do.
OlderNewer