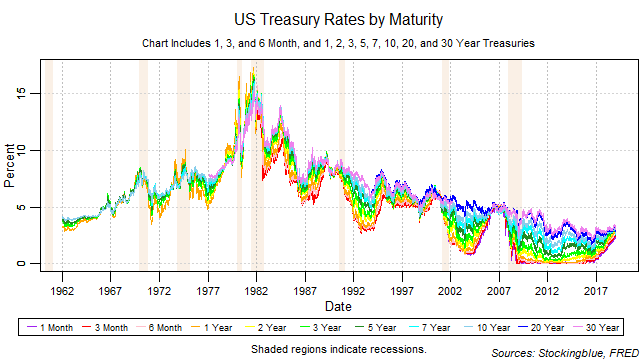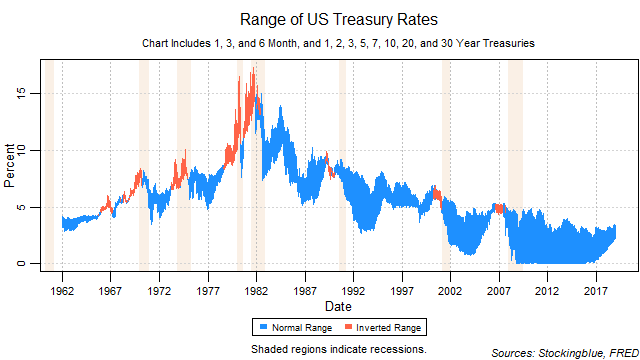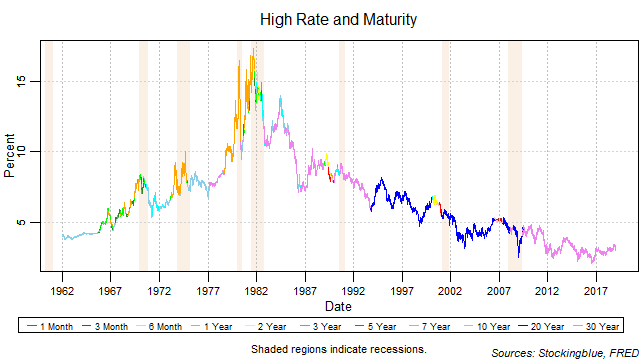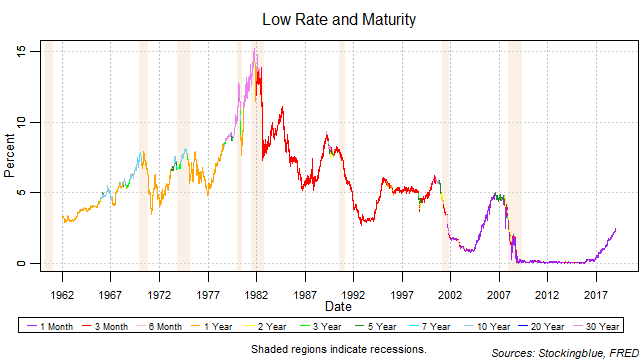
Short-term rates continued their dramatic turn upwards after being stuck at zero for several years while long-term rates made steady advances as well. The yield curve continued to narrow and it also narrowed from the bottom up. A narrowing from the short-term is a warning sign for an inversion that indicates recession.
Findings
- All rates rose in 2018.
- The one-month rate saw the largest absolute growth at 1.16 points.
- The seven-year rate saw the smallest rise at 0.26 points.
- On a relative basis, the one-month rate grew the most with a 90.63 percent rise.
- The 30-year rate rose the least on relative terms with a 10.22 percent rise.
- The one-month bill did not maintain the lowest rate throughout the year.
- The yield curve narrowed 0.88 points.
Caveats
- As always, past performance is not indicative of future results.
- The rates have been at historic lows for quite some time which has not occurred previously.
Details

The breadth of the yield curve narrowed over the year from a range of 1.46 to a range of 0.58. The widest range was 1.87 on February 22 and the narrowest 0.58 which occurred twice, once on December 24 and once on December 31.

The thirty-year bond held the highest rate throughout the year, although the rate has been started dropping precipitously since November.

The one-month bill held the lowest rate for nearly every session except for one session in January and three in December. It has been rising steadily throughout the course of the year which is a troubling sign.
Sources
"Treasury Constant Maturity," Federal Reserve Bank of St. Louis, accessed January 3, 2019, https://fred.stlouisfed.org/categories/115.