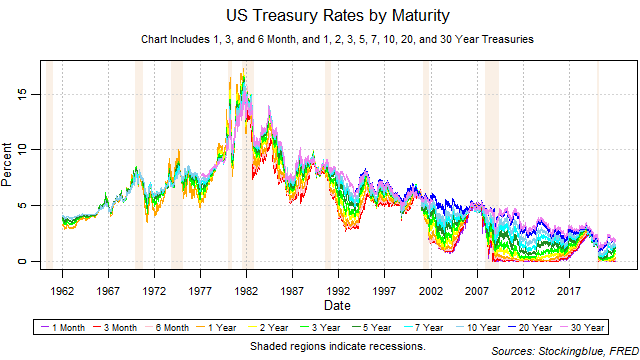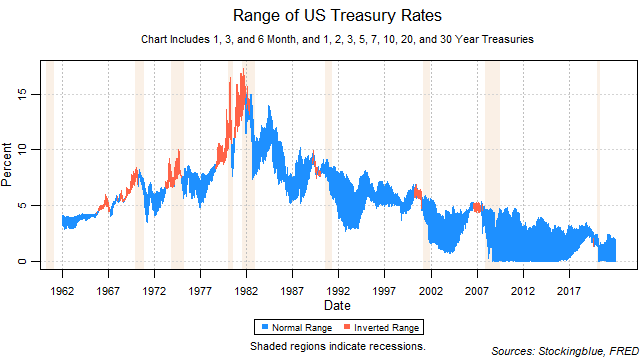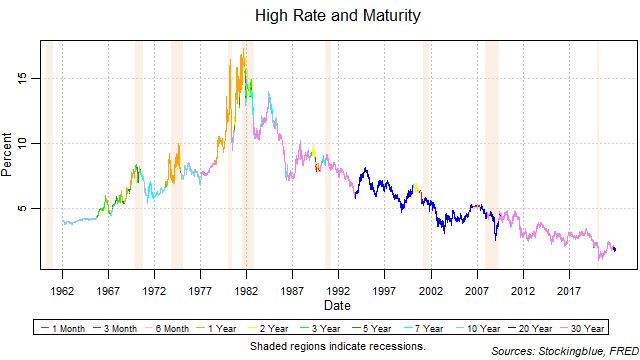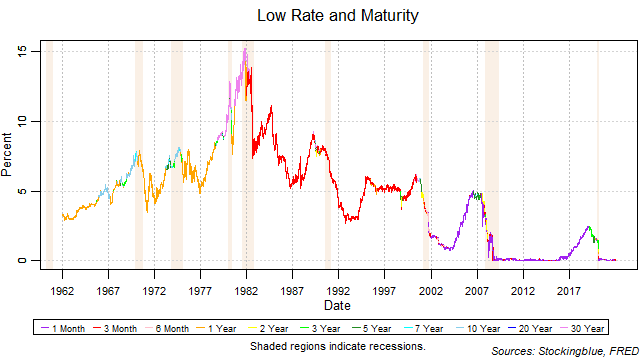
The one-month and three-month rates trended downwards for the third year in a row while all other rates went up ending their downward trend at two years. The yield curve widened over the course of the year. A narrowing from the short-term is a warning sign for an inversion that indicates recession.
Findings
- The one-month and three-month dropped in 2021 while all other rates rose.
- The five-year rate had the best absolute performance with a 0.90 point change.
- On a relative basis, the three-year rate had the best performance with a 470.59 percent change.
- The three-month rate had the worst absolute performance with a -0.03 point change.
- On a relative basis, the three-month rate had the worst performance with a -33.33 percent change.
- The one-month bill did not maintain the lowest rate throughout the year.
- The yield curve widened 0.27 points.
Caveats
- As always, past performance is not indicative of future results.
- The rates have been at historic lows for quite some time which has not occurred previously.
Details

The breadth of the yield curve widened over the year from a range of 1.57 to a range of 1.84. The widest range was 2.44 on March 18 and March 19 and the narrowest range was 1.57 which occurred on January 4.

The thirty-year bond did not hold the highest rate throughout the year.

The one-month bill had trouble holding the lowest rate for a good chunk of the year.
Sources
"Treasury Constant Maturity," Federal Reserve Bank of St. Louis, accessed January 5, 2022, https://fred.stlouisfed.org/categories/115.
"US Business Cycles and Contractions," National Bureau of Economic Research, accessed January 6, 2022, https://www.nber.org/research/data/us-business-cycle-expansions-and-contractions.