Treasuries have historically been a great indicator for recessions. The traditional view has been that when the yield curve inverts, a recession is soon on its way. This bond report will show trends and fluctuations in the treasury market from a new perspective. Ranges of rates as well as rates by maturity will be charted and analyzed to look for patterns that will help identify changes in the overall economy.
Findings
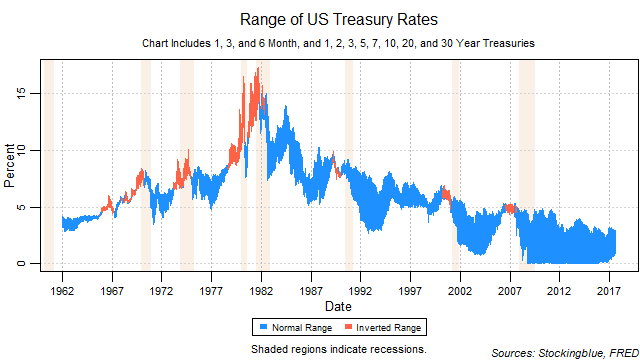
- Seven out of eight yield curve inversions have predicted recessions since 1962.
- All seven recessions since 1962 have followed an inversion of the yield curve.
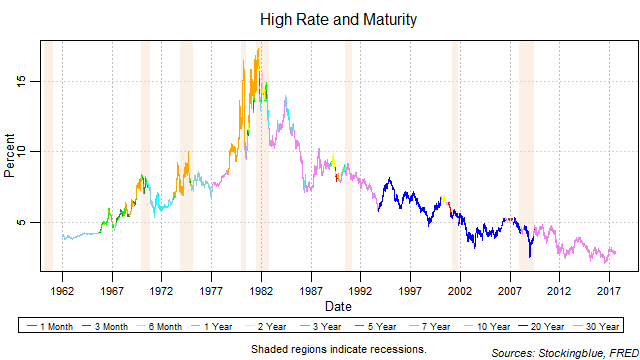
- Inverted yield curves are more likely to occur when the short-term maturity's rate ramps up than when the long-term maturity's rate deflates.
- The ramping up of short-term maturity's rates has led to an inverted yield curve eight out of eleven times since 1962.
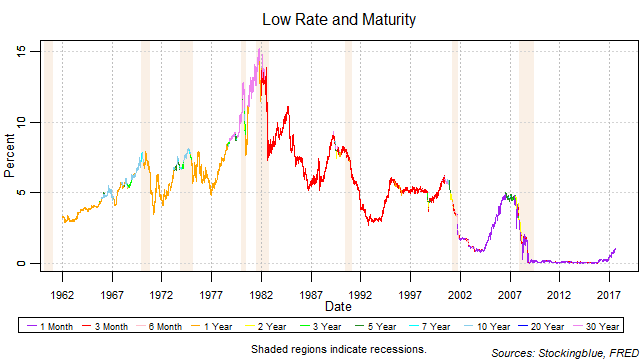
- Long-term rates drop after recessions.
Caveats
- As always, past performance is not indicative of future results.
- There is one yield curve inversion that has not predicted a recession.
- Coming out of this last recession, short-term rates have leveled off for a long period of time and hovered around zero.
- The short-term maturities lingering at or around zero percent for this long has not been seen before since the 1960s.
Details

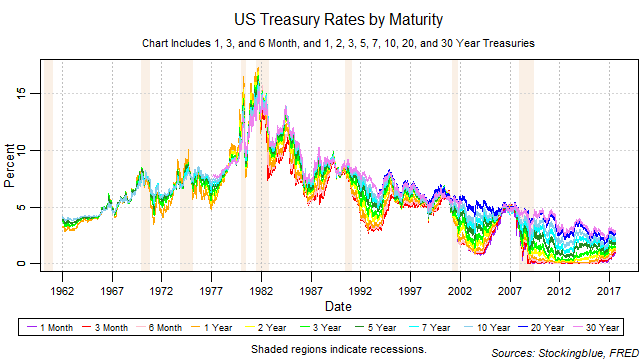
The chart above shows a pretty strong correlation between inverted yield curves and ensuing recessions. In addition, rates have been on a downward trend since their peak in the early 1980s. This trend though, may soon be coming to an end as rates have approached and even hit zero. The only way to go now is up. Unless, of course, we enter negative rate territory (which did occur briefly).
It is interesting to note though, that the dreaded narrowing of the yield curve does not always lead to an inversion of the curve. When we see the short-term maturity's rate ramp up toward the long-term maturity's rate an inverted yield curve is a possibility, however, not a certainty. But when the narrowing of the yield curve is due to the long-term maturity's rate deflating down towards the short-term's maturity rate, an inverted yield curve has yet to appear. Of the eight times we had an inverted curve, since 1962, seven of them preceded recessions. And all seven recessions in the same time period have followed an inverted yield curve.

Another interesting observation to note, long-term rates traditionally drop drastically after recessions. This did not occur after the most recent recession. Long-term rates took a while to drop and are continuing on a steady decline. From what we see in this chart we can assert that drops in long-term rates tend to be followed by growth in GDP.

We see a new pattern that made its first appearance in the early 1990s. That is the leveling off of the short-term rate for an extended period of time. It happened again in the mid 1990s. But the leveling off of the short-term rate for as long as we see now has not occurred before.
In the past year, we also notice the short-term rates ramping up and this is cause for concern as it is a pretty decent indicator for an ensuing inversion of the yield curve which itself is a strong indicator of an upcoming recession.
Sources
"Treasury Constant Maturity," Federal Reserve Bank of St. Louis, accessed August 21, 2017, https://fred.stlouisfed.org/categories/115.