Voter Turnout and Results by County in the 2018 Montana Senatorial Election

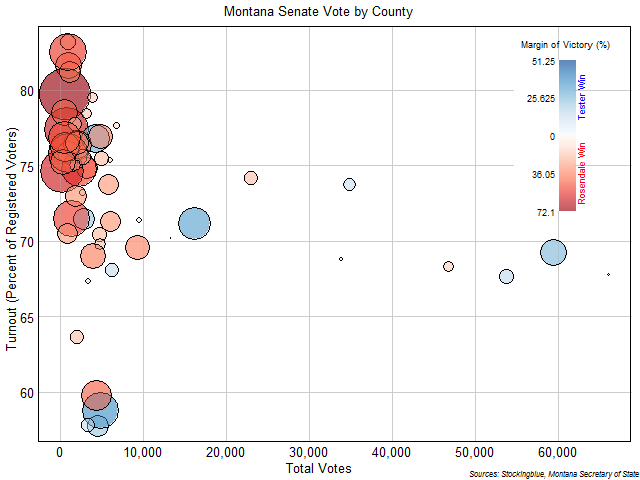
The chart above shows the total votes (x axis), the turnout (y axis), and the margin of victory (intensity of color and size of circle) for each county in the state of Montana. Jon Tester won two of the three largest counties as indicated by the blue circles to the right (just under the legend) with moderate margins. Matt Rosendale, on the other hand, won the majority of small counties (on the left of the chart) but with large margins. Rosendale also won the largest county, but with a very slim margin (small circle at the far right end). Rosendale also won counties with the largest voter turnout.
Voter Turnout and Results by County in the 2018 Texas Senatorial Election

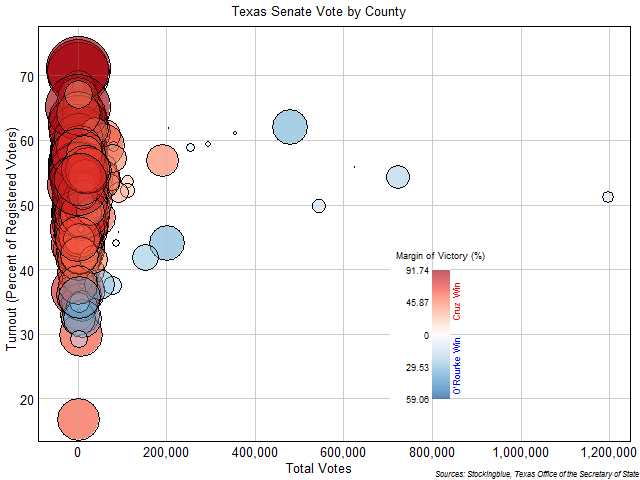
The chart above shows the total votes, the turnout, and the margin of victory for each county in the state of Texas. Beto O'Rourke won the five largest counties as indicated by the blue circles from the center to the right, but won them by such a small margin. Ted Cruz, on the other hand, won the majority of small counties but with really large margins. Ted Cruz won the counties with both the smallest and largest voter turnout.
Registered Voter Turnout in the 2017 Alabama Senatorial Election

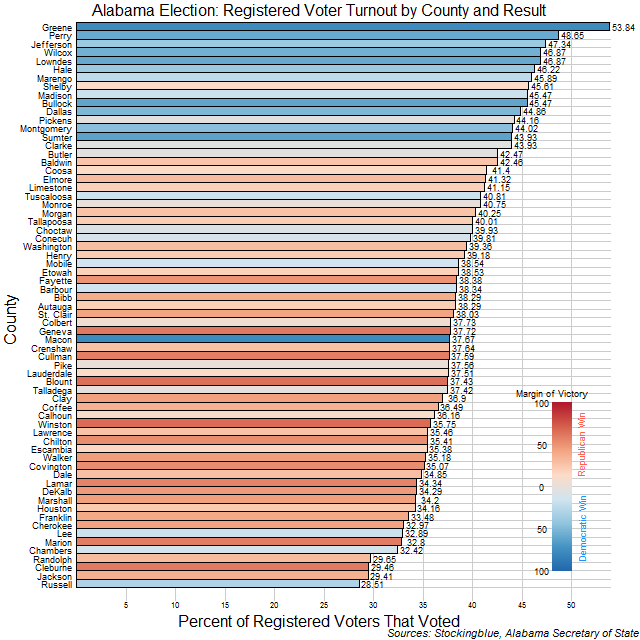
The chart above shows the percentage of registered voters that voted in each county and the party that won said county. The Democrats won the counties where a greater percentage of registered voters showed up to vote. The only decisive victory the Democrats had where registered voters did not really show up to the polls was in Macon County. The Republicans only won one county (Shelby) where registered voters actually showed up in great numbers.
Voter Registration in the 2017 Alabama Senatorial Election

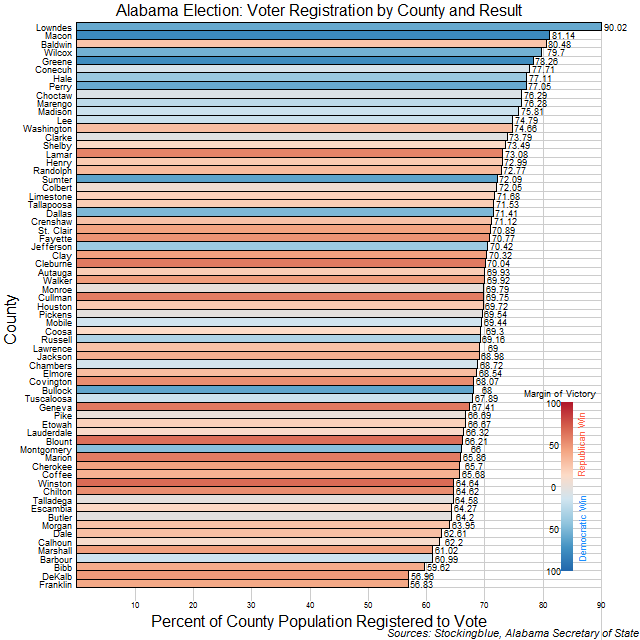
The chart above shows the percentage of people that are registered to vote in each county and the party that won each county. The Democrats won the counties where a greater percentage of the population is registered to vote. There are some anomalies in the data as Lowndes County has 90 percent of its population registered to vote but 30 percent of its population is under the age of 18 according to the US Census. Several other counties also had more registered voters than voters eligible to vote.