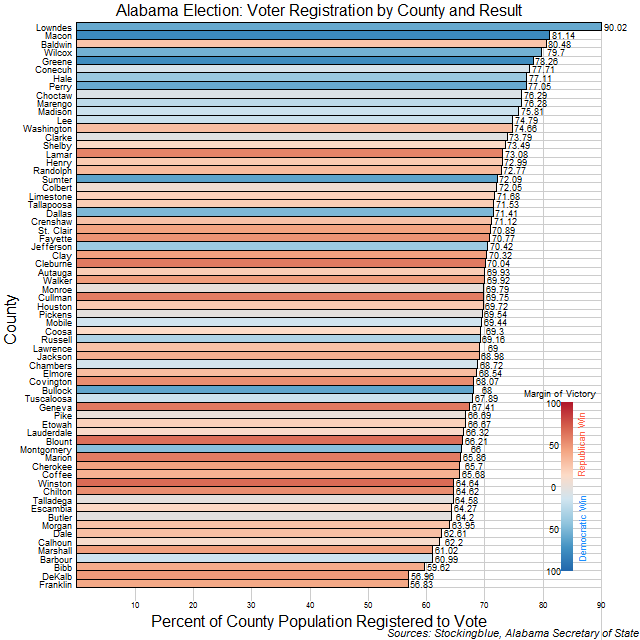
The chart above shows the percentage of people that are registered to vote in each county and the party that won each county. The Democrats won the counties where a greater percentage of the population is registered to vote. There are some anomalies in the data as Lowndes County has 90 percent of its population registered to vote but 30 percent of its population is under the age of 18 according to the US Census. Several other counties also had more registered voters than voters eligible to vote.
Findings
- Of the 10 counties with the highest voter registration, nine were won by the Democratic candidate.
- Conversely, of the 10 counties with the lowest voter registration, eight were won by the Republican candidate.
- All counties in Alabama have more than half their population registered to vote.
- Only eleven counties have more than three-fourths of their total population registered to vote.
Caveats
- The data may include people that are no longer part of the county's population as several counties report more registered voters than their latest Census data indicates would be eligible to vote.
- Although there are more registered voters than eligible voters, the post on voter turnout indicates that there were no obvious anomalies with actual voters as less people voted than are eligible to vote.
Details
Doug Jones did well in counties where a great portion of the population is registered to vote.
Several counties have more registered voters than they have eligible voters, whether this means that they do not do a good job of keeping their records up to date or there is some nefarious activity going on cannot be surmised by looking at the data.
Sources
Alabama Secretary of State. "Alabama Votes." Accessed December 13, 2017. http://www2.alabamavotes.gov/electionNight/chooseCounty.aspx?ecode=1000915.