EU and US Regions by Annual Riders per Mile of Subway Track
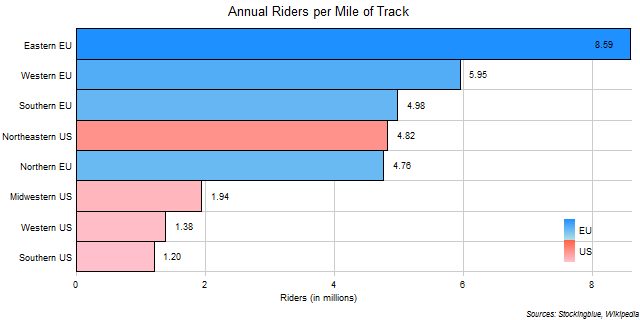
The chart above shows the number of annual riders for every mile of track in each EU and US region. One million annual riders is the equivalent of 2,740 riders a day. EU regions dominate in this metric.
EU Regions by Annual Riders per Kilometer of Subway Track

The chart above shows the number of annual riders for every kilometer of track in each EU region. One million annual riders is the equivalent of 2,740 riders a day. The Eastern EU is the only region with over 4 million annual riders for every kilometer of subway track.
US Regions by Annual Riders per Mile of Subway Track

The chart above shows the number of annual riders for every mile of track in each US region. One million annual riders is the equivalent of 2,740 riders a day. Unsurprisingly, the Northeast dominates in this metric.
EU and US States by Annual Riders per Mile of Subway Track
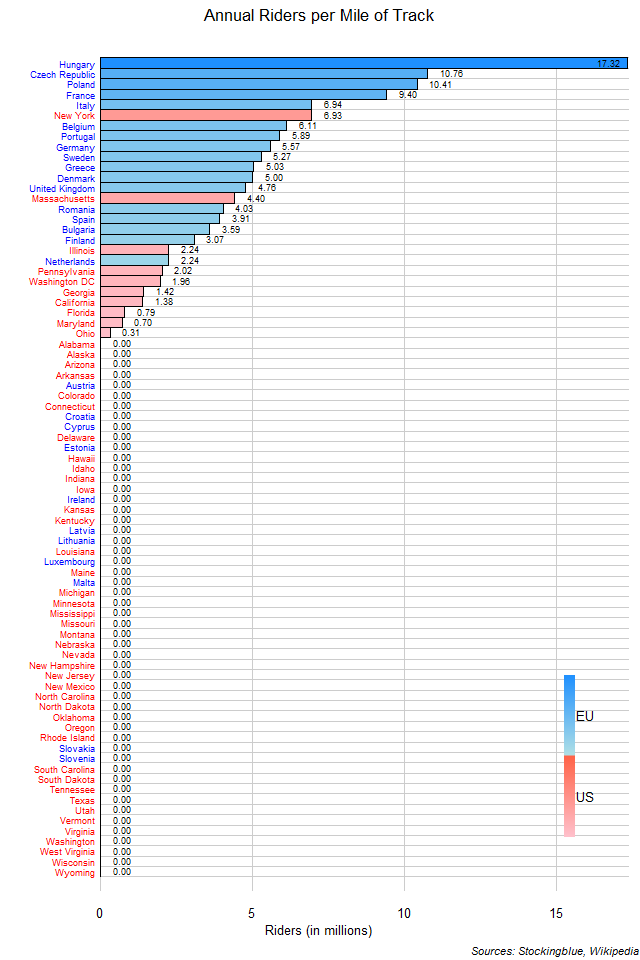
The chart above shows the number of annual riders for every mile of track in each state. One million annual riders is the equivalent of 2,740 riders a day. EU states tend to pack in more riders for every unit of track than US states do.
EU States by Annual Riders per Kilometer of Subway Track
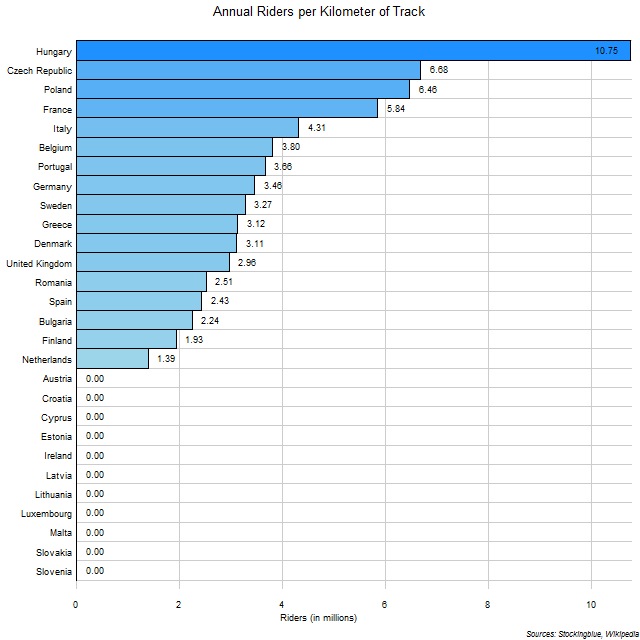
The chart above shows the number of annual riders for every kilometer of track in each state. One million annual riders is the equivalent of 2,740 riders a day. So the Netherlands has 3,808 daily riders for every kilometer of track while Hungary has 29,452.
US States by Annual Riders per Mile of Subway Track
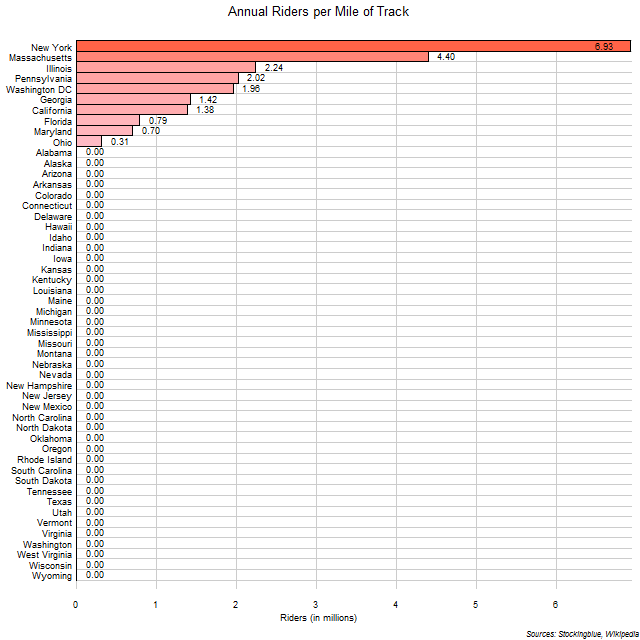
The chart above shows the number of annual riders for every mile of track in each state. One million annual riders is the equivalent of 2,740 riders a day. So Ohio has 849 daily riders for every mile of track while New York has 18,986.
EU and US Regions by Annual Riders per Subway Station
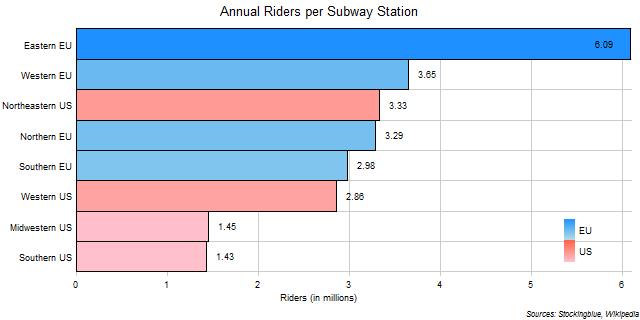
The chart above shows the number of annual riders for every subway station in each EU and US region. One million annual riders is the equivalent of 2,740 riders a day. The Eastern EU dominates all other regions.
EU Regions by Annual Riders per Subway Station

The chart above shows the number of annual riders for every subway station in each EU region. One million annual riders is the equivalent of 2,740 riders a day. The Eastern EU is in a class all its own.
US Regions by Annual Riders per Subway Station

The chart above shows the number of annual riders for every subway station in each US region. One million annual riders is the equivalent of 2,740 riders a day. Unsurprisingly, the Northeast leads in this metric.
EU and US States by Annual Riders per Subway Station
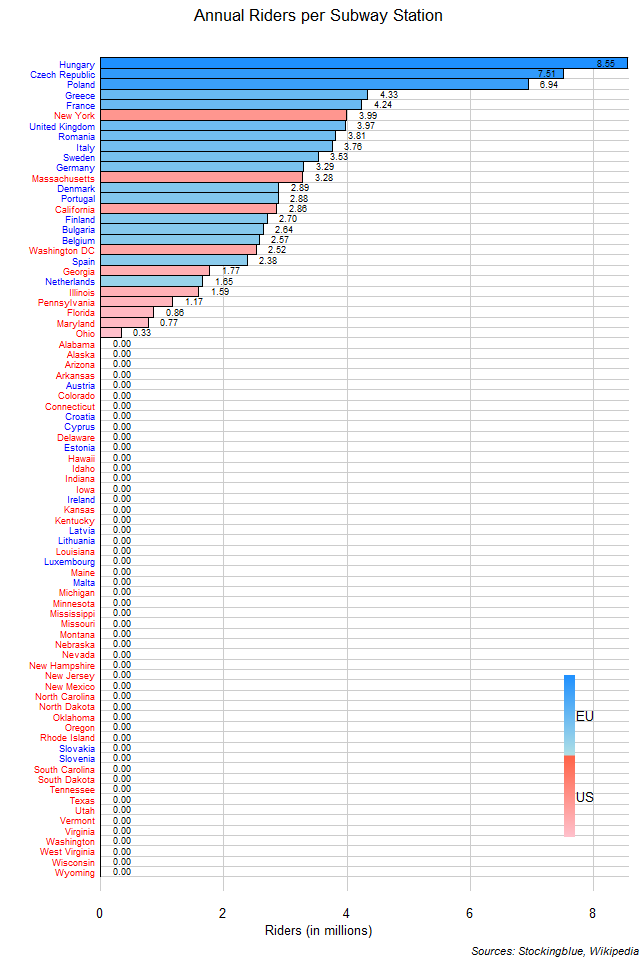
The chart above shows the number of annual riders for every subway station in each EU and US state. One million annual riders is the equivalent of 2,740 riders a day. So Ohio has 904 daily riders for every station while Hungary has 23,425.
Older