Transportation-Based Carbon Dioxide Emissions for Every Thousand Dollars of GDP in EU and US Regions
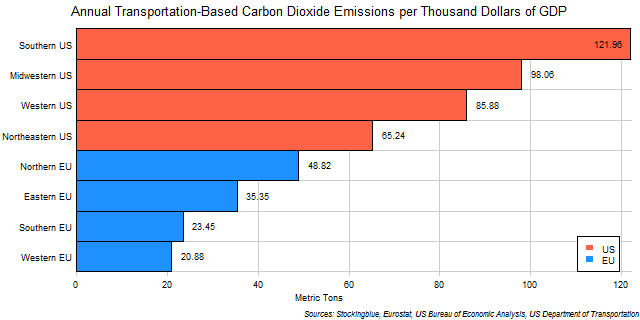
The chart above shows transportation-based carbon dioxide emissions broken down by economic output in EU and US regions. Every single US region emits more than every single EU region.
Transportation-Based Carbon Dioxide Emissions for Every Thousand Euros of GDP in EU Regions

The chart above shows transportation-based carbon dioxide emissions broken down by economic output in EU regions. The Northern EU is by far the leading emitter of transportation-based carbon dioxide in this metric.
Transportation-Based Carbon Dioxide Emissions for Every Thousand Dollars of GDP in US Regions

The chart above shows transportation-based carbon dioxide emissions broken down by economic output in US regions. The South is by far the leading emitter of transportation-based carbon dioxide in this metric.
Transportation-Based Carbon Dioxide Emissions for Every Thousand Dollars of GDP in EU and US States
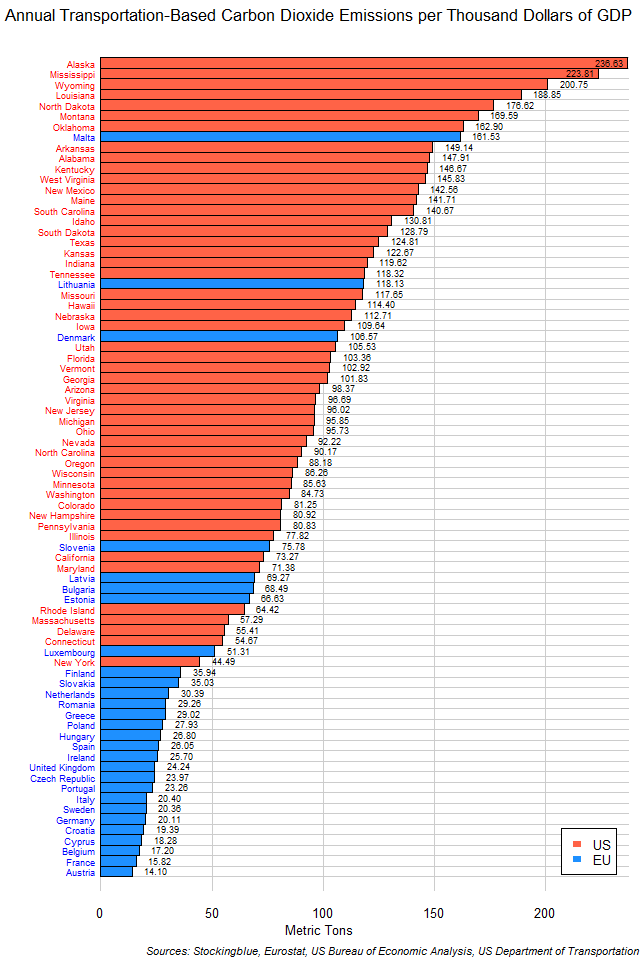
The chart above shows transportation-based carbon dioxide emissions broken down by economic output in EU and US states. Only one EU state ranks in the top 20 emitters. Not one US state is in the bottom 20 in this metric.
Transportation-Based Carbon Dioxide Emissions for Every Thousand Euros of GDP in EU States
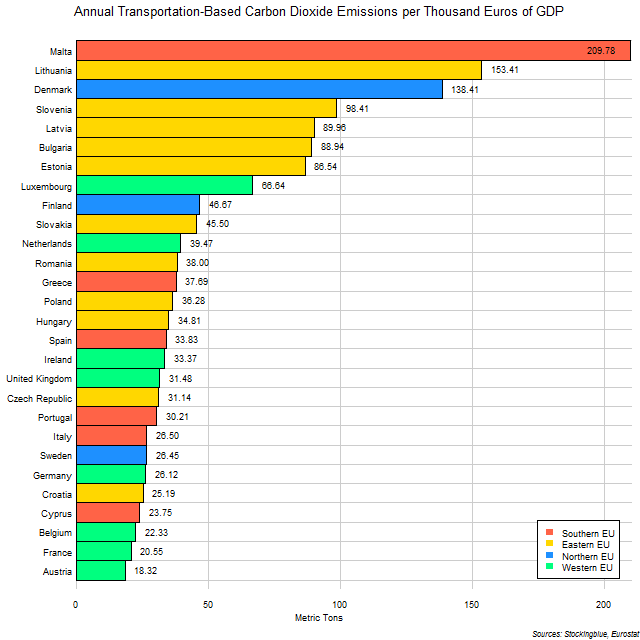
The chart above shows transportation-based carbon dioxide emissions broken down by economic output in EU states. Three out of the top five polluting states in this metric are from the Eastern EU.
Transportation-Based Carbon Dioxide Emissions for Every Thousand Dollars of GDP in US States
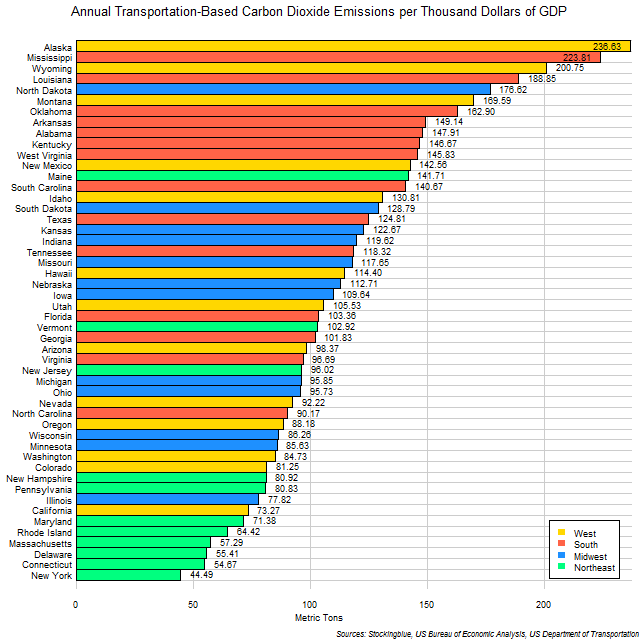
The chart above shows transportation-based carbon dioxide emissions broken down by economic output in US states. Six of the top ten emitting states are in the South and if Alaska is excluded due to its unique transportation network, seven of the top ten are from the South.
Per Capita Transportation-Based Carbon Dioxide Emissions in EU and US Regions
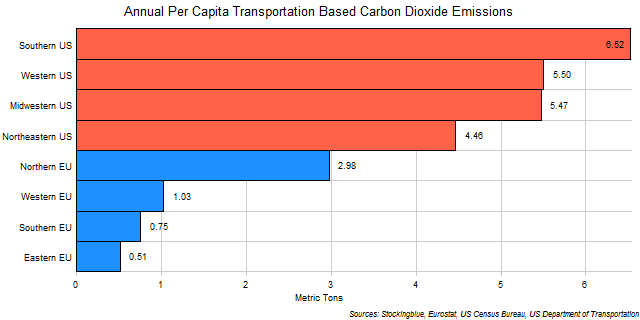
The chart above shows transportation-based carbon dioxide emissions broken down by population in EU and US regions. Every single US region emits more transportation-based carbon dioxide per capita than any EU region.
Per Capita Transportation-Based Carbon Dioxide Emissions in US Regions

The chart above shows transportation-based carbon dioxide emissions broken down by population in US regions. The South emits the most out of all the regions but the differences between the regions are not all that high.
Per Capita Transportation-Based Carbon Dioxide Emissions in EU Regions

The chart above shows transportation-based carbon dioxide emissions broken down by population in EU regions. The Northern EU emits more carbon dioxide per person than all the other three regions combined.
Per Capita Transportation-Based Carbon Dioxide Emissions in EU and US States
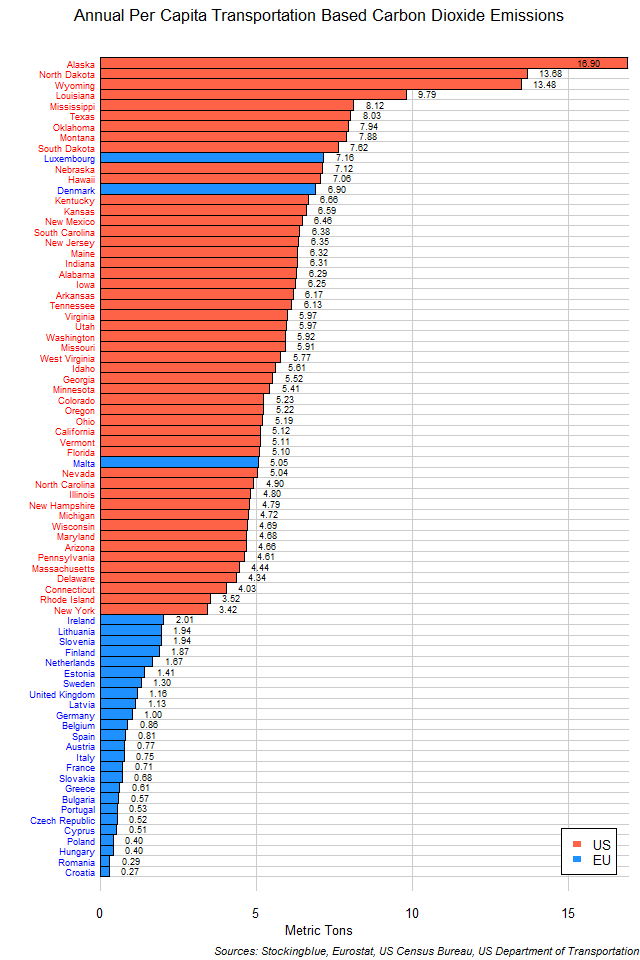
The chart above shows transportation-based carbon dioxide emissions broken down by population in EU and US states. With the exceptions of Luxembourg, Denmark, and Malta, every other EU state emits less carbon dioxide than every single US state.
Older