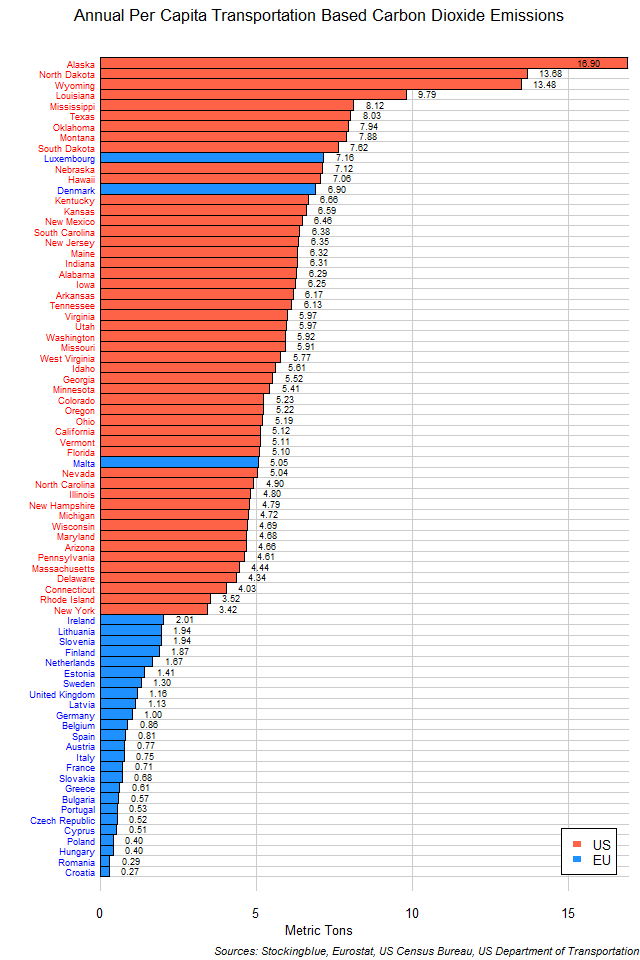
The chart above shows transportation-based carbon dioxide emissions broken down by population in EU and US states. With the exceptions of Luxembourg, Denmark, and Malta, every other EU state emits less carbon dioxide than every single US state.
Findings
- The difference between the state with the most per capita emissions, Alaska, and the state with the least, Croatia, is 16.62 metric tons.
- Alaska emits 62.11 times the per capita carbon dioxide that Croatia does.
- The mean per capita transportation-based carbon dioxide emissions for the 28 EU states is 1.54 and the median 0.83.
- The mean per capita transportation-based carbon dioxide emissions for the 50 US states is 6.35 and the median 5.92.
- The mean per capita transportation-based carbon dioxide emissions for the 78 EU and US states is 4.62 and the median 5.04.
- Only one EU state ranks in the top ten in this metric.
- The 25 states with the lowest emissions per capita are all EU states.
Caveats
- EU population data is from 2011. US population data is from 2010.
- EU and US emissions data is from 2013.
- All figures are rounded to the nearest hundredth.
- US population and emissions data come from different sources.
- EU and US data come from different sources.
- The road network is very limited in Alaska, so much so that the state capital is not connected by road, and one in 78 people are pilots.
Details
Alaska emits the most carbon dioxide per capita from its transportation sources mostly because of the unique nature of its transportation network in which bush planes play a significant role. The only EU states to rival US states in this metric are Luxembourg, Denmark, and Malta. It's surprising to see Denmark so high as bicycles are a key part of its transportation network. It should be interesting to see what the emissions are per unit of economic output, the next posts will look into that.
The European Union as a whole emits 0.93 metric tons of carbon dioxide per person from transportation sources annually ranking it under Germany and just above Belgium (and below every single US state). The United States as a whole emits 5.64 metric tons of carbon dioxide per person from transportation sources annually ranking it under West Virginia and just above Idaho (and above every EU state save for Luxembourg and Denmark).
Sources
Eurostat. 2017. "Data Explorer." Accessed December 11, 2017. http://appsso.eurostat.ec.europa.eu/nui/show.do?dataset=urb_lpop1&lang=en.
Eurostat. 2018. "Eurostat - Data Explorer: Air Emissions Accounts." Accessed April 17, 2018. http://appsso.eurostat.ec.europa.eu/nui/show.do?query=BOOKMARK_DS-286146_QID_2207DEA6_UID_-3F171EB0&layout=TIME,C,X,0;GEO,L,Y,0;AIRPOL,L,Z,0;NACE_R2,L,Z,1;UNIT,L,Z,2;INDICATORS,C,Z,3;&zSelection=DS-286146INDICATORS,OBS_FLAG;DS-286146UNIT,T;DS-286146NACE_R2,H;DS-286146AIRPOL,CO2;&rankName1=UNIT_1_2_-1_2&rankName2=AIRPOL_1_2_-1_2&rankName3=INDICATORS_1_2_-1_2&rankName4=NACE-R2_1_2_-1_2&rankName5=TIME_1_0_0_0&rankName6=GEO_1_2_0_1&sortC=ASC_-1_FIRST&rStp=&cStp=&rDCh=&cDCh=&rDM=true&cDM=true&footnes=false&empty=false&wai=false&time_mode=NONE&time_most_recent=false&lang=EN&cfo=%23%23%23%2C%23%23%23.%23%23%23.
United States Census Bureau. "Annual Estimates of the Resident Population: April 1, 2010 to July 1, 2016." Accessed March 21, 2018. https://factfinder.census.gov/faces/tableservices/jsf/pages/productview.xhtml?pid=PEP_2016_PEPANNRES&src=pt.
United States Department of Transportation. 2015. "State Transportation by the Numbers." Accessed March 21, 2018. https://www.bts.gov/sites/bts.dot.gov/files/legacy/_entire.pdf.