GDP and Change in GDP in US Regions between 2008 and 2017

The chart above shows the GDP and change in GDP over the last ten years in US regions in US dollars. All four regions grew in the past ten years and their growth rates were pretty similar.
GDP and Change in GDP in EU and US States between 2008 and 2017
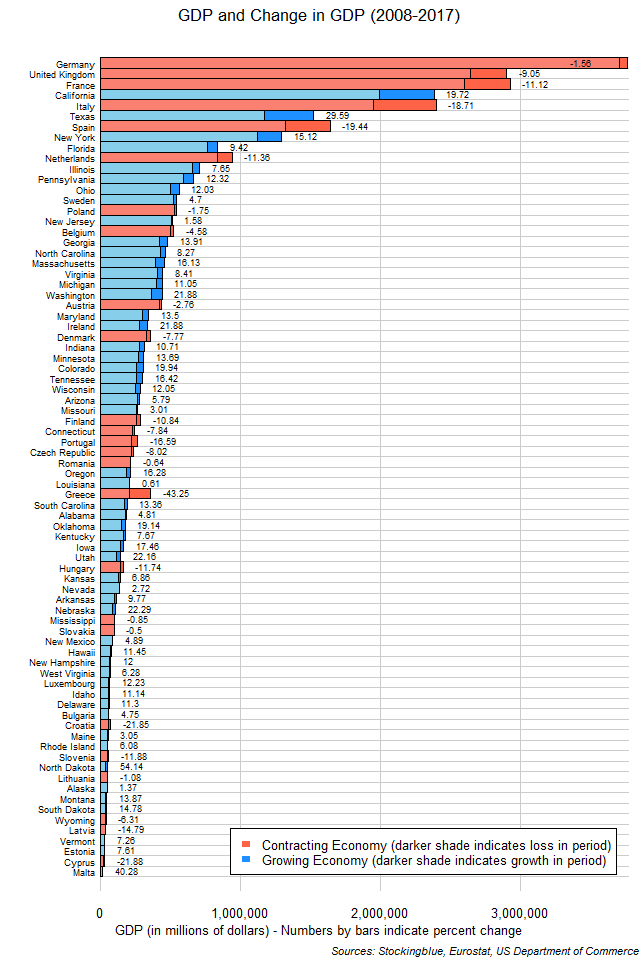
The chart above shows the GDP and change in GDP over the last ten years in EU and US states in US dollars. Although the three largest economies all shrank in the ten year period, they managed to remain the three largest economies, even though the second and third largest economies swapped places.
GDP and Change in GDP in US States between 2008 and 2017
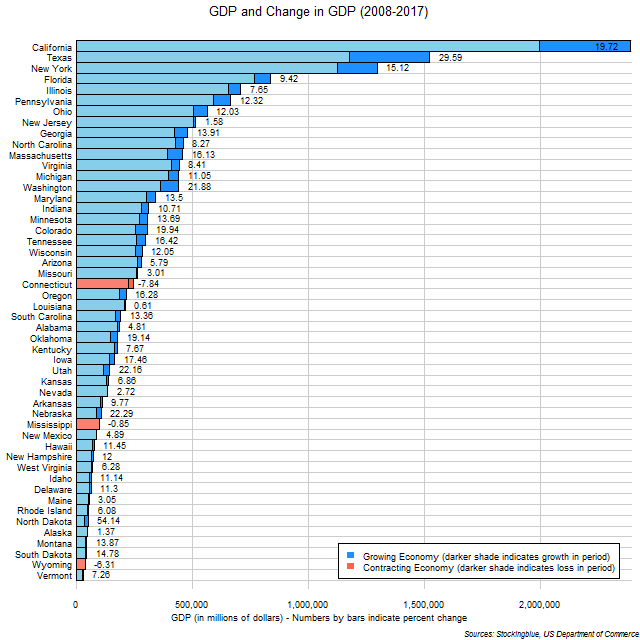
The chart above shows the GDP and change in GDP over the last ten years in US states. The Californian economy grew by more in the past ten years than the entire economy of 36 US states.
GDP and Change in GDP in EU States between 2008 and 2017
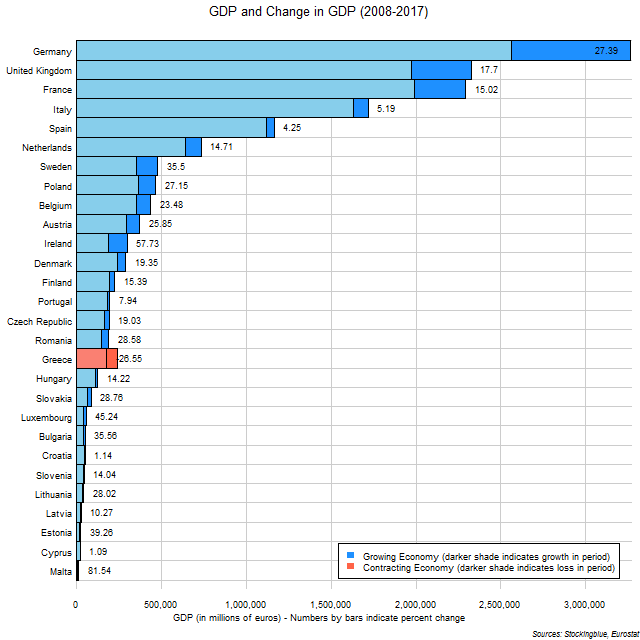
The chart above shows the GDP and change in GDP over the last ten years in EU states. The German economy grew by more in the past ten years than the entire economy of 22 EU states.
Economic Growth and Contraction in EU and US Regions between 2016 and 2017
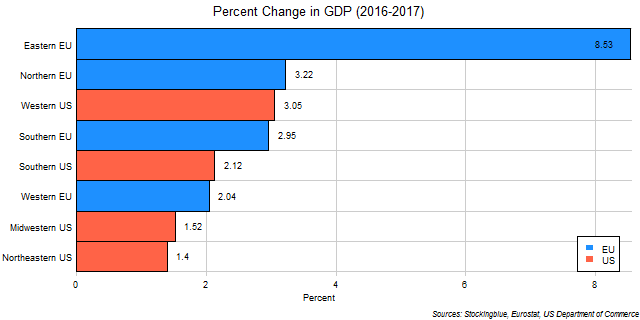
The chart above shows change in GDP over the last year in EU and US regions. The Eastern EU was the fastest growing region in both the EU and the US by far.
Economic Growth and Contraction in EU Regions between 2016 and 2017

The chart above shows change in GDP over the last year in EU regions. The Eastern EU grew by more than twice as much as the second fastest growing region last year.
Economic Growth and Contraction in US Regions between 2016 and 2017

The chart above shows change in GDP over the last year in US regions. The Western US was, by far, the fastest growing region last year.
Economic Growth and Contraction in EU and US States between 2016 and 2017
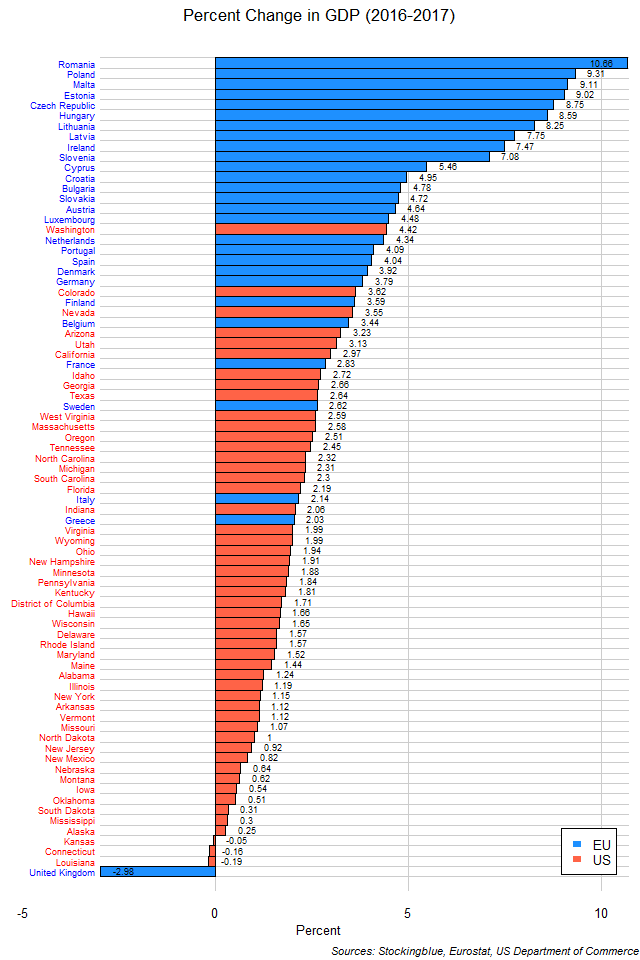
The chart above shows change in GDP over the last year in EU and US states. The 16 fastest growing states last year were all in the EU. The fastest growing US state ranks 17th overall. However, the state with the largest contraction is also from the EU (although not for long).
Economic Growth and Contraction in US States between 2016 and 2017
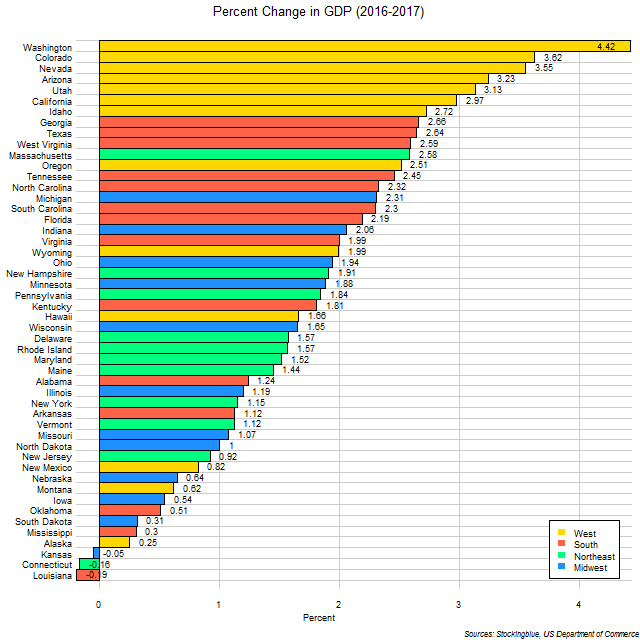
The chart above shows change in GDP over the last year in US states. Seven out of the top ten (and all of the top seven) states with the highest growth are from the West while the remaining three are all from the South.
Economic Growth and Contraction in EU States between 2016 and 2017
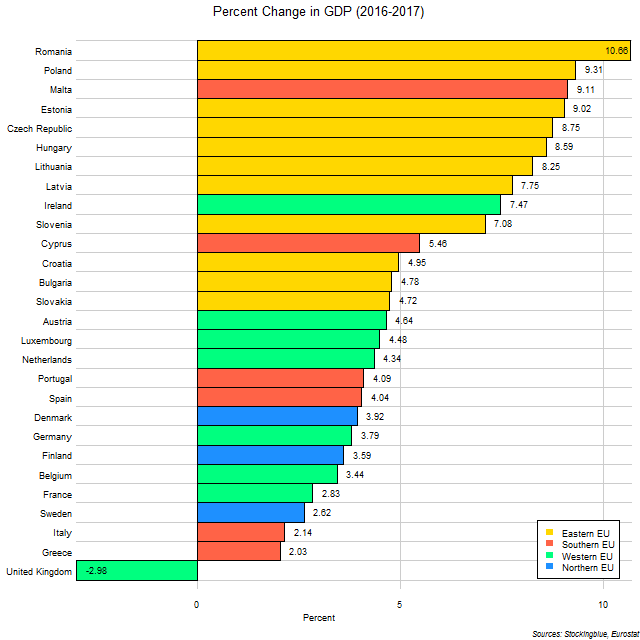
The chart above shows change in GDP over the last year in EU states. Only Romania has grown its economy by over a tenth while the United Kingdom is the only EU state whose economy shrank over the past year.
OlderNewer