Per Capita GDP and Change in Per Capita GDP in US States between 2008 and 2017
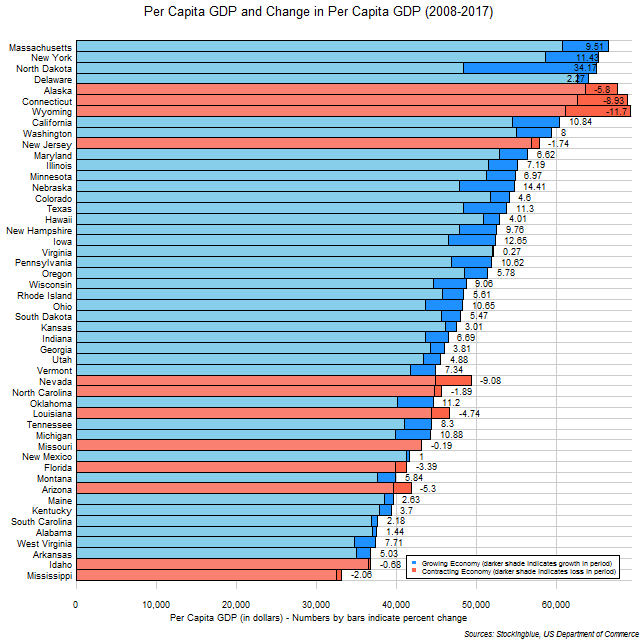
The chart above shows the per capita GDP and change in per capita GDP over the last ten years in US states. North Dakota had both the greatest absolute growth in per capita GDP as well as the greatest growth rate in per capita GDP in the ten year period.
Per Capita GDP and Change in Per Capita GDP in EU States between 2008 and 2017
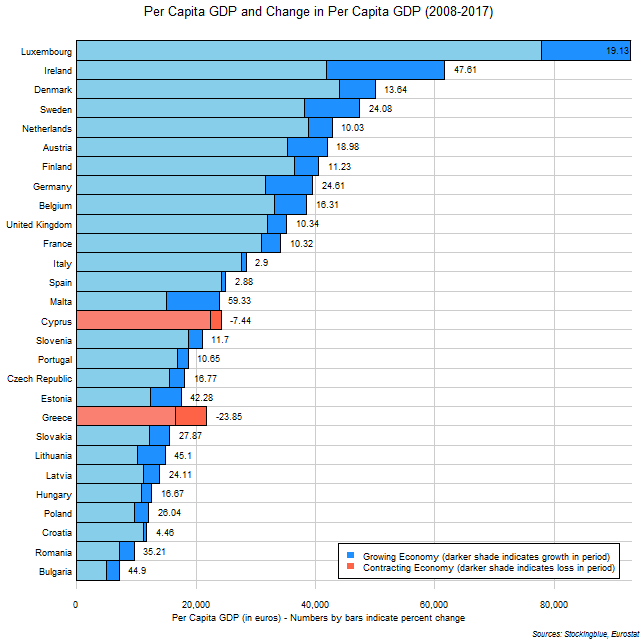
The chart above shows the per capita GDP and change in per capita GDP over the last ten years in EU states. Malta had the largest growth rate but Luxembourg had the greatest absolute growth in the ten-year period. Greece and Cyprus were the only two states whose per capita GDP contracted in the period.
GDP and Change in GDP in EU and US Regions between 2016 and 2017
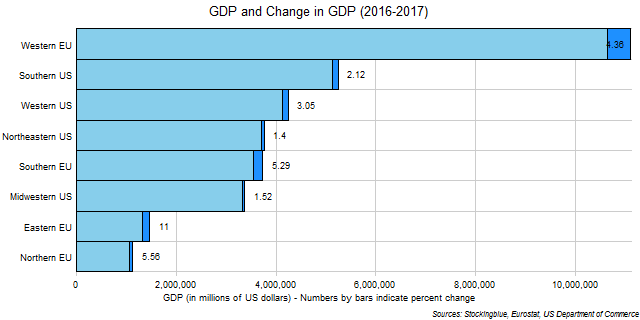
The chart above shows the GDP and change in GDP over the last year in EU and US regions in US dollars. All four EU regions had higher growth rates than all four US regions in the past year.
GDP and Change in GDP in EU Regions between 2016 and 2017

The chart above shows the GDP and change in GDP over the last year in EU regions. Although the Eastern EU had the highest growth rate last year at 8.53%, it was the Western EU that had the greatest absolute growth in the Union with a growth of €195,329,300,000 even though it had the lowest growth rate of all the regions.
GDP and Change in GDP in US Regions between 2016 and 2017

The chart above shows the GDP and change in GDP over the last year in US regions. The Western US had both the greatest growth and the greatest growth rate. However, the South did remain the region with the greatest economy.
GDP and Change in GDP in EU and US States between 2016 and 2017
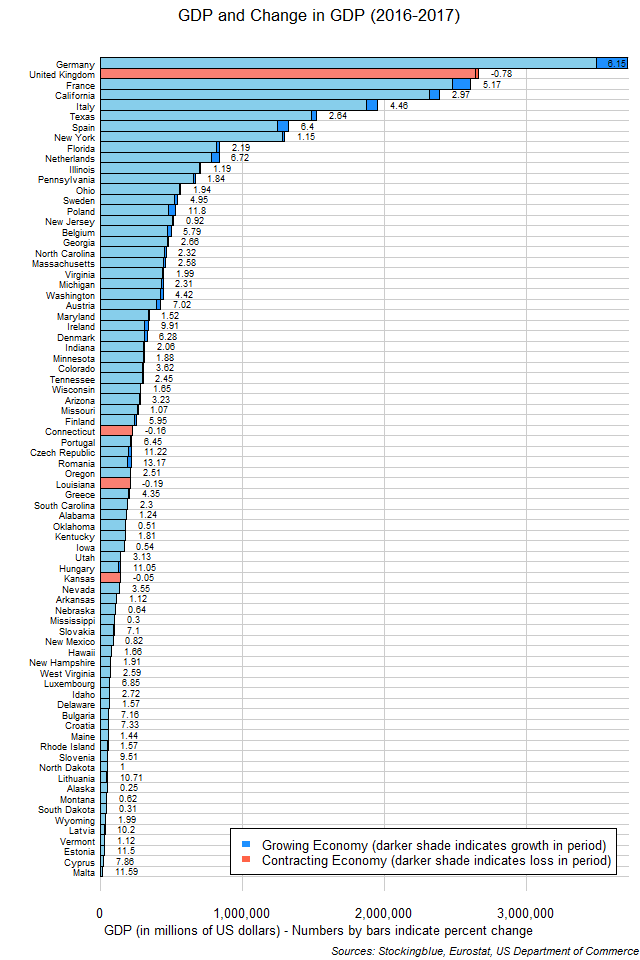
The chart above shows the GDP and change in GDP over the last year in EU and US states in US dollars. Although Germany had less than half the relative growth rate of Romania, it had the largest absolute growth of all the states.
GDP and Change in GDP in US States between 2016 and 2017
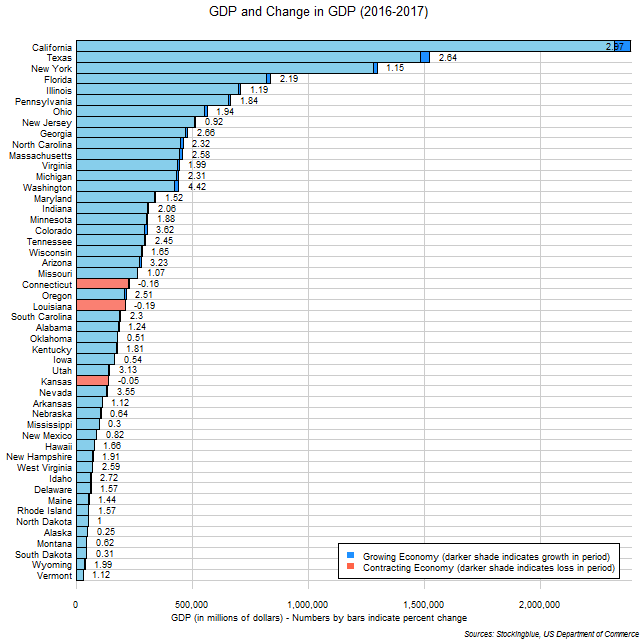
The chart above shows the GDP and change in GDP over the last year in US states in dollars. Although Washington had the sixth greatest relative growth at 2.97%, it had the largest absolute growth of all the states.
GDP and Change in GDP in EU States between 2016 and 2017
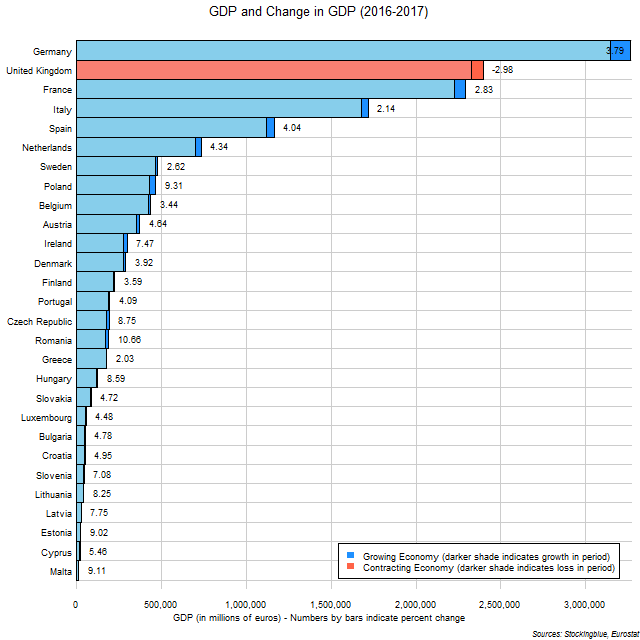
The chart above shows the GDP and change in GDP over the last year in EU states in euros. Although Germany had far from the greatest relative growth at 3.79%, it had the largest absolute growth in the Union nearly double that of the second largest absolute growth seen in France and German growth accounted for over one out of every four euros of growth in the entire Union.
GDP and Change in GDP in EU and US Regions between 2008 and 2017
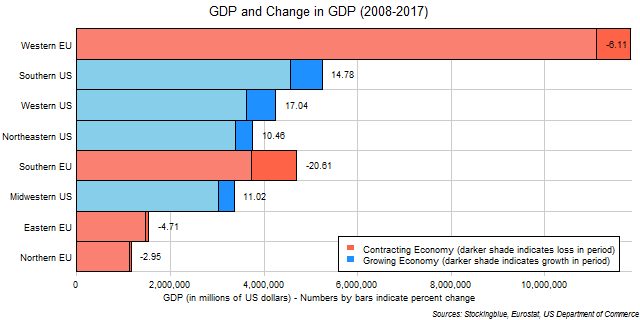
The chart above shows the GDP and change in GDP over the last ten years in EU and US regions in US dollars. All four US regions grew in the past ten years while all four EU regions shrank in the past ten years (when priced in US dollars).
GDP and Change in GDP in EU Regions between 2008 and 2017

The chart above shows the GDP and change in GDP over the last ten years in EU regions in euros. All four regions grew in the past ten years however, the Southern EU had a considerably small relative growth rate than the other three regions.
OlderNewer