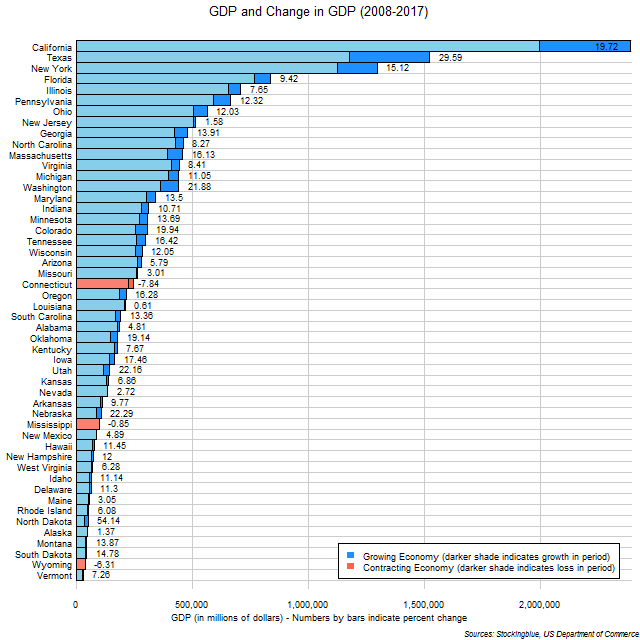
The chart above shows the GDP and change in GDP over the last ten years in US states. The Californian economy grew by more in the past ten years than the entire economy of 36 US states.
Findings
- The difference between the state with the greatest absolute growth in GDP, California, and the state with the least, Alaska, is $392,507,000,000.
- California has 617 times the absolute economic growth that Alaska does in the past ten years.
- Ohio has surpassed New Jersey in the ten year period and is now the seventh largest economy in the US.
- Georgia has surpassed North Carolina.
- Massachusetts has surpassed Virginia and Michigan.
- Arizona dropped below Colorado, Wisconsin, and Tennessee, while Missouri was surpassed by Colorado and Wisconsin, and Tennessee was surpassed by Colorado.
- Oregon surpassed Louisiana, South Carolina surpassed Alabama, and Oklahoma surpassed Kentucky.
- Nevada dropped below Utah and Kansas while Utah also surpassed Kansas.
- Nebraska surpassed Mississippi, and New Hampshire surpassed West Virginia.
- Finally, North Dakota surpassed Alaska, Wyoming, Montana, and South Dakota, while Montana and South Dakota surpassed Wyoming.
Caveats
- All percentages are rounded to the nearest hundredth.
Details
North Dakota had the greatest growth in relative terms over the past ten years, which helped it to surpass four states. California had the seventh largest relative growth rate, but the greatest absolute growth rate, however Texas' absolute growth rate was not far behind and its relative growth rate was much larger than California's.
The United States as a whole grew by $1,982,473 million over the ten year period.
Sources
US Department of Commerce. 2018. "US Bureau of Economic Analysis." Accessed June 26, 2018. https://bea.gov/itable/iTable.cfm?ReqID=70&step=1#reqid=70&step=10&isuri=1&7003=1000&7035=-1&7004=naics&7005=1&7006=01000,02000,04000,05000,06000,08000,09000,10000,11000,12000,13000,15000,16000,17000,18000,19000,20000,21000,22000,23000,24000,25000,26000,27000,28000,29000,30000,31000,32000,33000,34000,35000,36000,37000,38000,39000,40000,41000,42000,44000,45000,46000,47000,48000,49000,50000,51000,53000,54000,55000,56000&7036=-1&7001=11000&7002=1&7090=70&7007=2017,2016,2015,2014,2013,2012,2011,2010,2009,2008,2007,2006&7093=levels.