EU Regional Unemployment Rates, November 2020

The chart above shows the unemployment rate in each EU region as of November 2020 (unless otherwise noted - see caveats below), the change from the previous month, and the rate one year prior. The Western EU was the only region to see a rise in the unemployment rate over the previous month.
US Regional Unemployment Rates, November 2020

The chart above shows the unemployment rate in each US region as of November 2020, the change from the previous month, and the rate one year prior. The South was the only region to see a rise in its rate over the previous month.
EU and US Unemployment Rates, November 2020
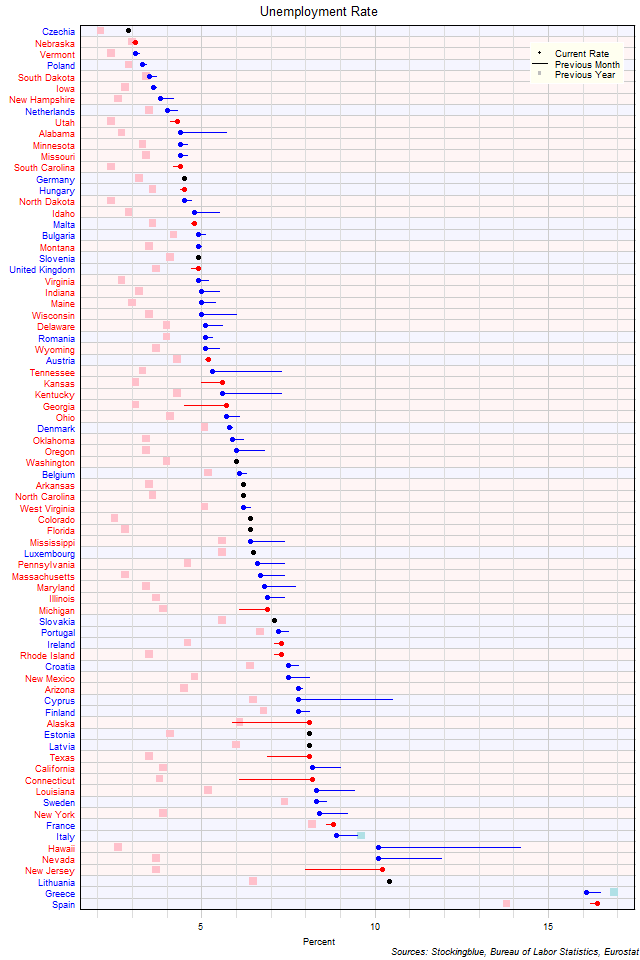
The chart above shows the unemployment rate in each EU and US state as of November 2020 (unless otherwise noted - see caveats below), the change from the previous month, and the rate one year prior. Czechia is the only state with an unemployment rate below three percent. No US states have a rate below three percent.
EU Unemployment Rates, November 2020
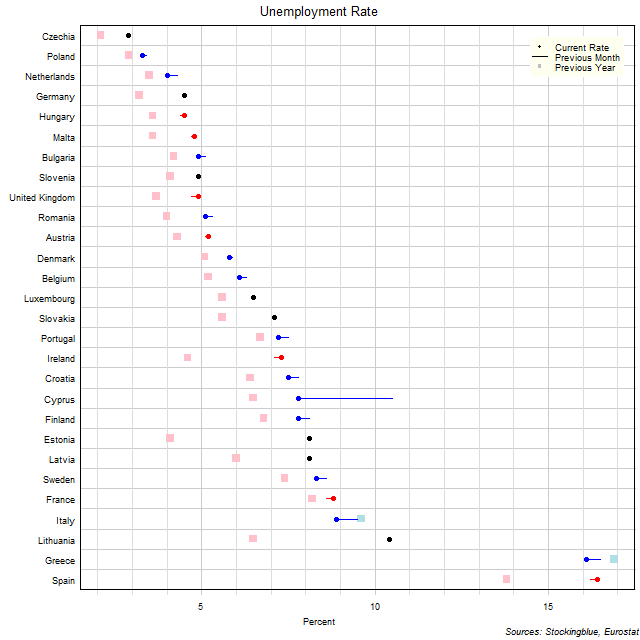
The chart above shows the unemployment rate in each EU state as of November 2020 (unless otherwise noted - see caveats below), the change from the previous month, and the rate one year prior. Czechia is the only state with an unemployment rate below three percent.
US Unemployment Rates, November 2020
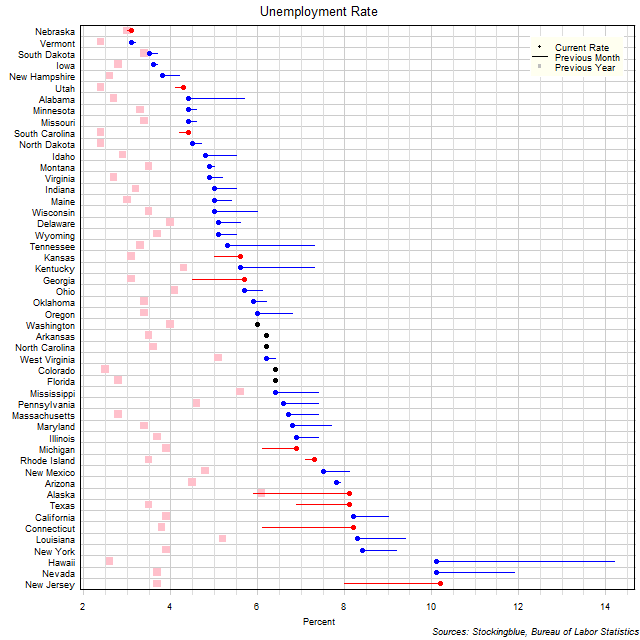
The chart above shows the unemployment rate in each US state as of November 2020, the change from the previous month, and the rate one year prior. The unemployment rate continues to drop in most states resulting in five states with a rate below four percent.
EU Long-Term Interest Rates, November 2020
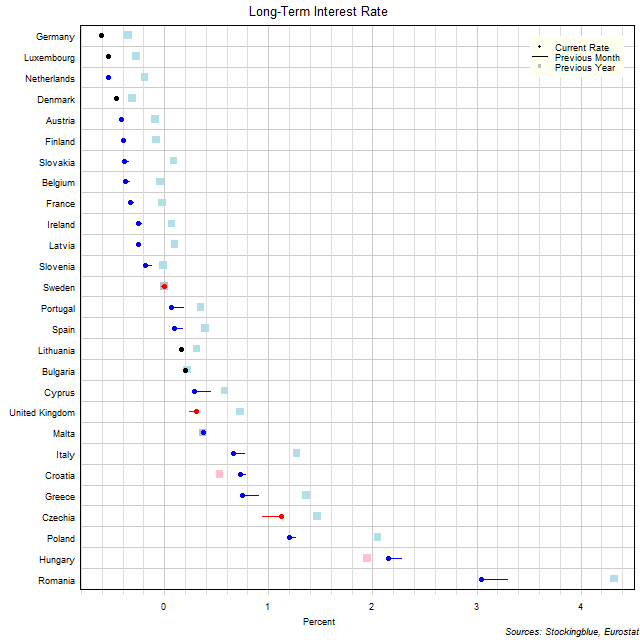
The chart above shows the ten-year interest rate in each EU state as of November 2020, the change from the previous month, and the rate one year prior. Twelve states have a negative interest rate (down from 13 last month and up from nine last year).
A Look Back at Treasuries in 2020
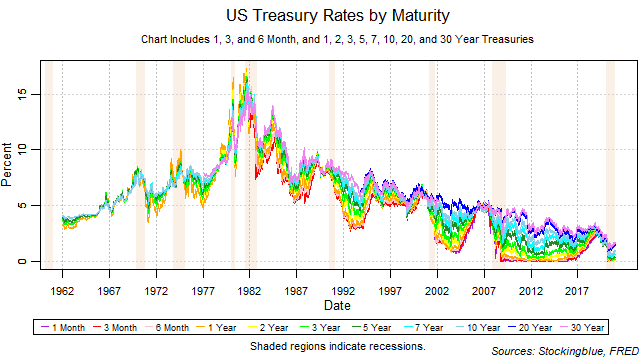
All rates trended downwards for the second year in a row. The yield curve widened over the course of the year. A narrowing from the short-term is a warning sign for an inversion that indicates recession.
Treasury Rate Movements, December 2020
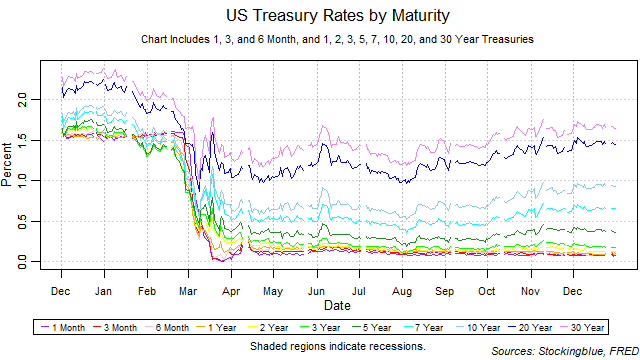
The one-year, two-year, and three-year rates fell, the one-month, six-month, and five-year rates stayed the same, and all other rates rose in December. The yield curve widened from the previous month thus ending its narrowing streak of one month. The one-month bill did not maintain the lowest rate throughout the month. There were no moves upwards on short-term rates thus decreasing the risk of an inversion brought upon by rising short-term rates. Such an inversion, if it were to happen would be a strong indicator for an upcoming recession.
Per Capita GDP by EU and US State, Third Quarter 2020
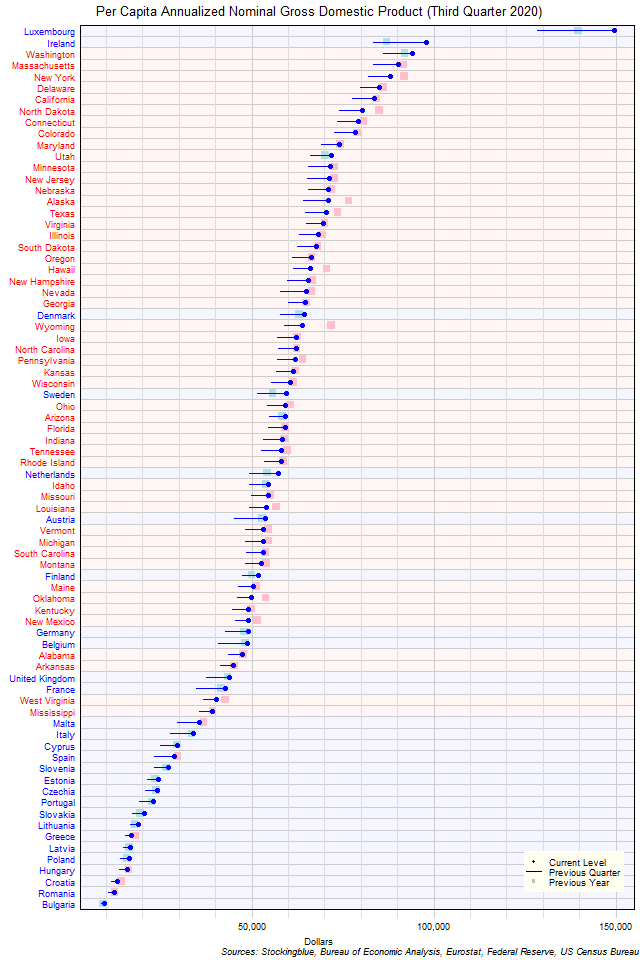
The chart above shows the per capita annualized nominal gross domestic product (GDP) in each EU and US state as of the third quarter of 2020 in dollars, the change from the previous quarter, and the GDP one year prior. Every single state's per capita GDP grew over the past quarter.
Per Capita GDP by EU State, Third Quarter 2020
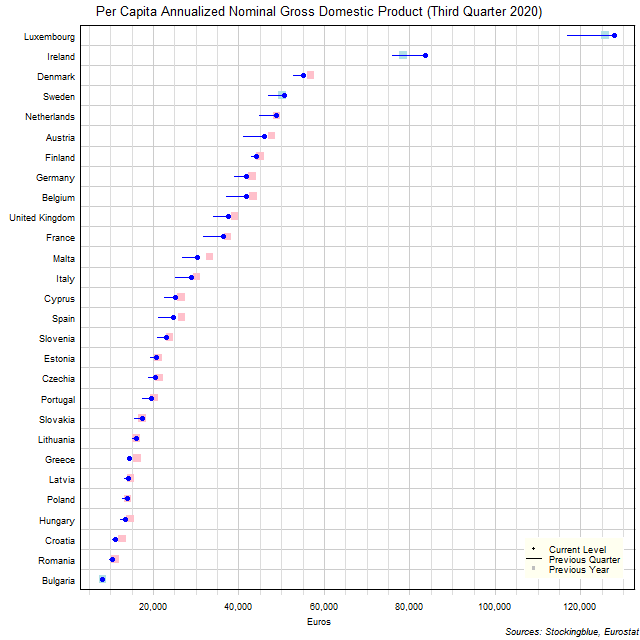
The chart above shows the per capita annualized nominal gross domestic product (GDP) in each EU state as of the third quarter of 2020 in euros, the change from the previous quarter, and the GDP one year prior. Every single state's economy grew over the past quarter.
OlderNewer