Per Capita Road Coverage in EU and US States
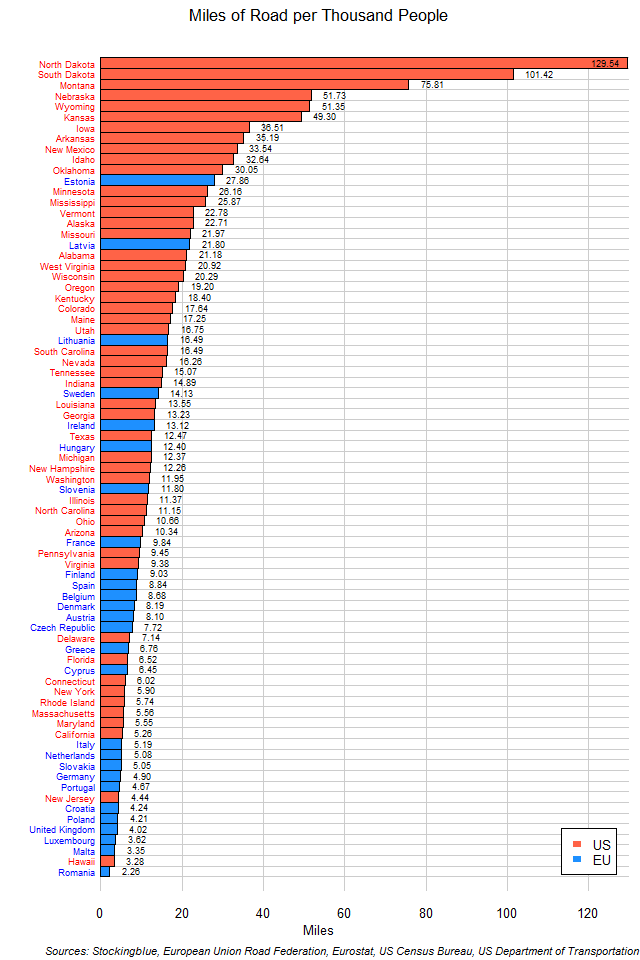
The chart above shows road lengths per thousand people in EU and US states. The top ten states are all from the US with the leading EU state in this metric showing up 12th.
Transportation-Based Carbon Dioxide Emissions for Every Thousand Dollars of GDP in EU and US Regions
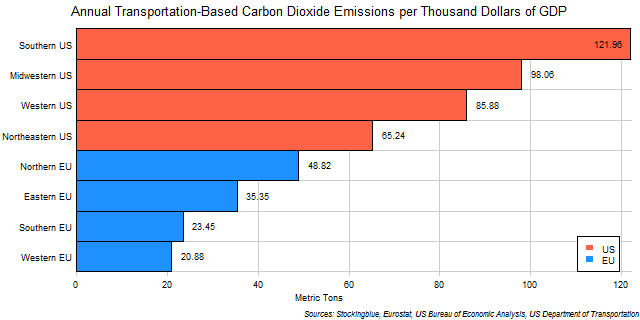
The chart above shows transportation-based carbon dioxide emissions broken down by economic output in EU and US regions. Every single US region emits more than every single EU region.
Transportation-Based Carbon Dioxide Emissions for Every Thousand Dollars of GDP in EU and US States
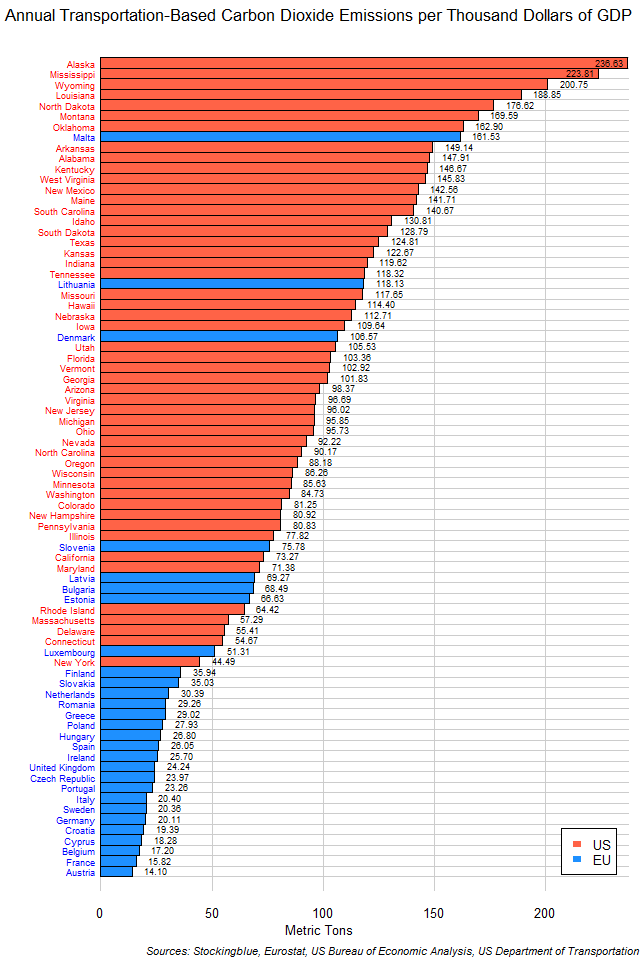
The chart above shows transportation-based carbon dioxide emissions broken down by economic output in EU and US states. Only one EU state ranks in the top 20 emitters. Not one US state is in the bottom 20 in this metric.
Per Capita Transportation-Based Carbon Dioxide Emissions in EU and US Regions
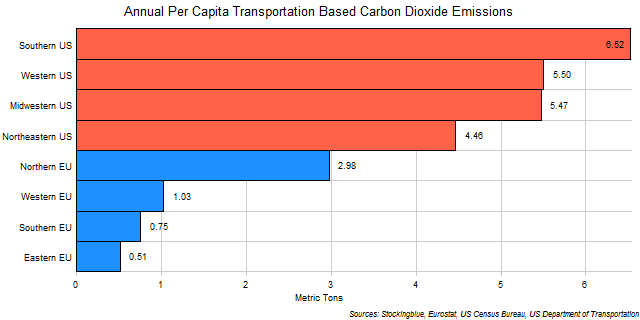
The chart above shows transportation-based carbon dioxide emissions broken down by population in EU and US regions. Every single US region emits more transportation-based carbon dioxide per capita than any EU region.
Per Capita Transportation-Based Carbon Dioxide Emissions in EU and US States
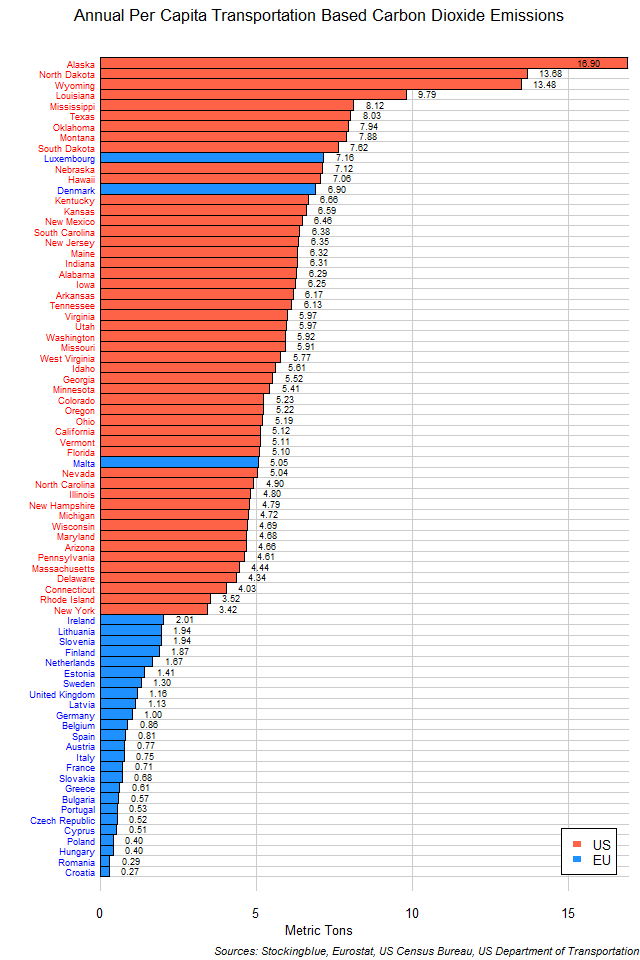
The chart above shows transportation-based carbon dioxide emissions broken down by population in EU and US states. With the exceptions of Luxembourg, Denmark, and Malta, every other EU state emits less carbon dioxide than every single US state.
Transportation Based Carbon Dioxide Emissions in EU and US Regions
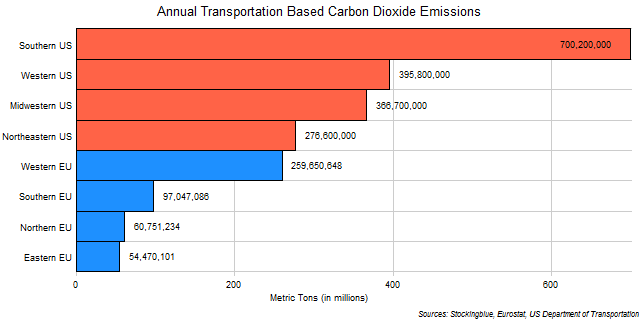
The chart above shows transportation based carbon dioxide emissions in EU and US regions. Clearly, US regions emit far more transportation-based carbon dioxide than EU regions do.
Transportation Based Carbon Dioxide Emissions in EU and US States
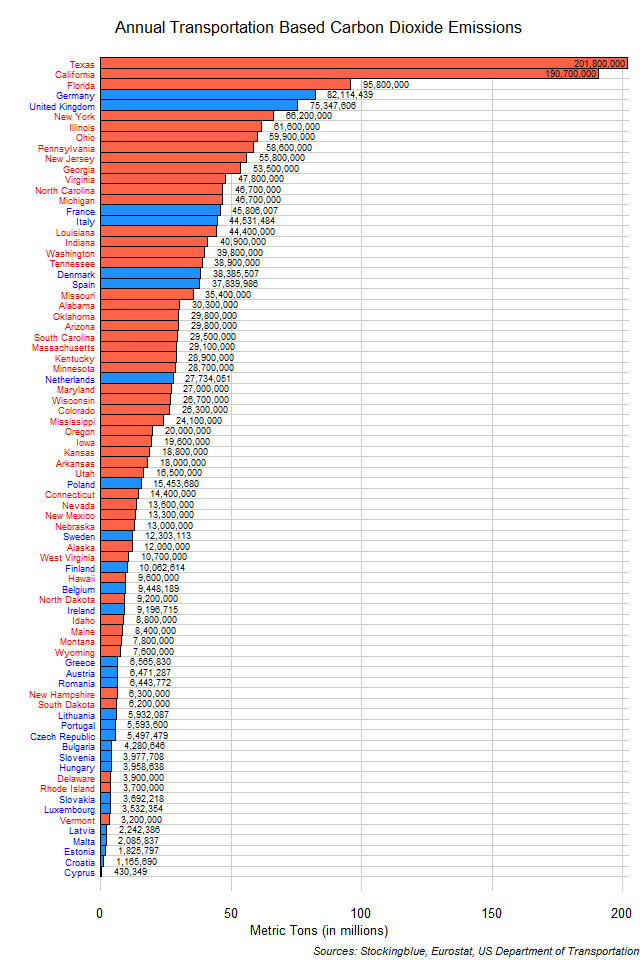
The chart above shows transportation based carbon dioxide emissions in EU and US states. One-quarter of all carbon dioxide emissions from transportation use in the EU and the US come from four states (out of 78): Texas, California, Florida, and Germany. In addition, Texas and California are the only two states that emit more than 100 million metric tons.
Rail Coverage in EU and US Regions
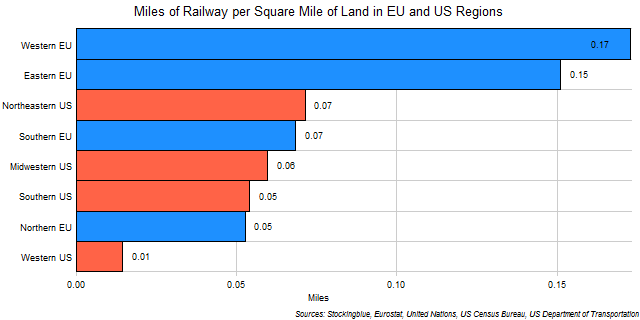
The chart above shows the miles of rail per square mile of land in EU and US regions. The Europeans have more rail per unit of land than we Americans do which is not surprising at all. What is surprising is that the EU's region with the least rail coverage rivals the US's region with the most rail coverage.
Rail Coverage in EU and US States
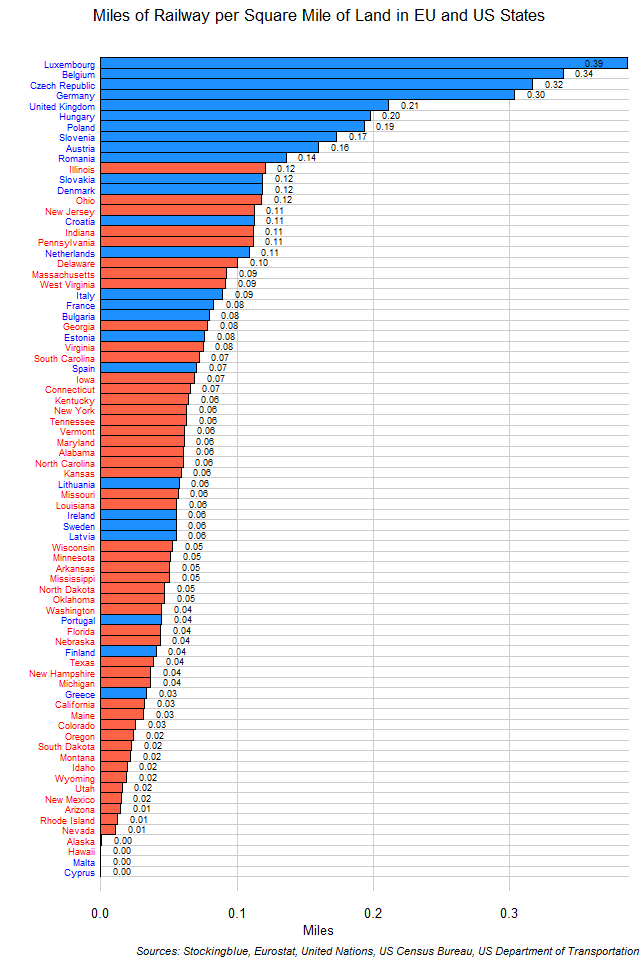
The chart above shows the miles of rail per square mile of land in EU and US states. The ten states with the greatest railway coverage are all in the EU. Illinois, which is the US state with the greatest railway coverage ranks 11th. On the flip side, the 14 states with the least railway coverage are all in the US with Greece, the EU state with the least rail per unit of land coming in at 15th lowest (excluding Hawaii, Malta, and Cyprus which have no rail networks).
Miles of Roadway per Square Mile of Land in EU and US Regions
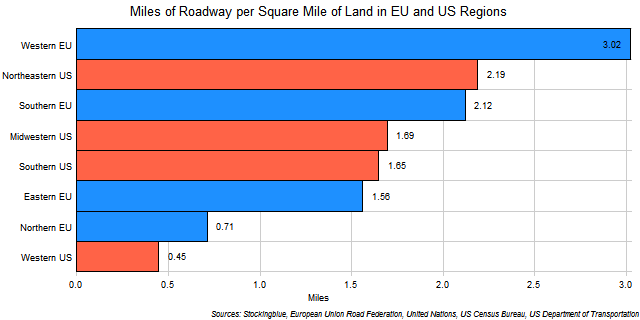
The chart above shows the miles of roads per square mile of land in EU and US regions. Only the Western EU has more than three miles of road for every square mile of territory.
OlderNewer