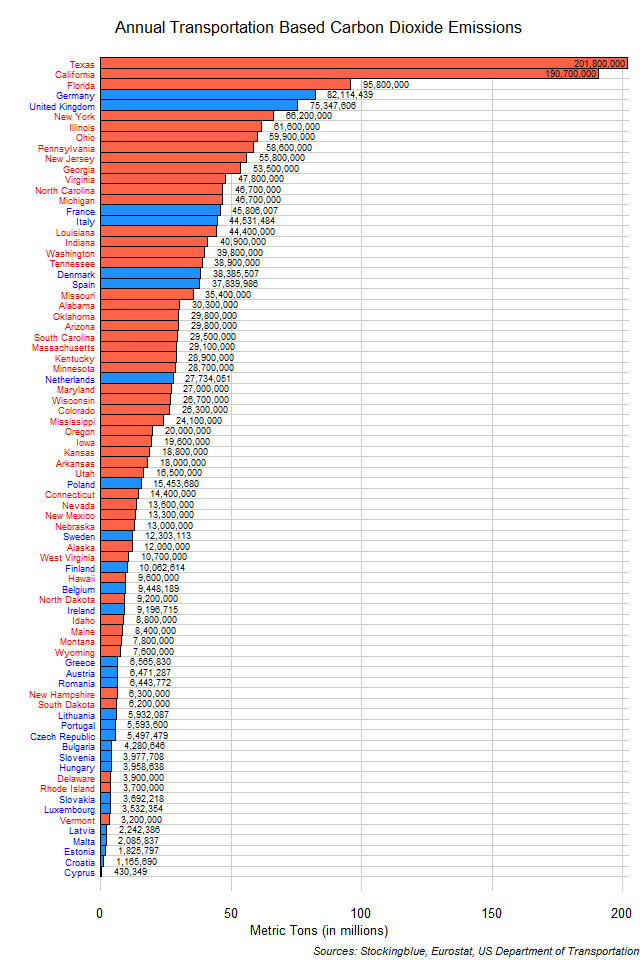
The chart above shows transportation based carbon dioxide emissions in EU and US states. One-quarter of all carbon dioxide emissions from transportation use in the EU and the US come from four states (out of 78): Texas, California, Florida, and Germany. In addition, Texas and California are the only two states that emit more than 100 million metric tons.
Findings
- The difference between the state with the most emissions, Texas, and the state with the least, Cyprus, is 201 million metric tons.
- Texas emits 469 times the carbon dioxide that Cyprus does.
- Thirteen out of 78 states are responsible for half of the carbon dioxide emitted from transportation sources.
- Only one state emits less than one million metric tons: Cyprus.
- The mean number of metric tons emitted in the US from transportation sources is 34,786,000, and the median 26,850,000.
- The mean number of metric tons emitted in the EU from transportation sources is 16,854,252, and the median 6,457,530.
Caveats
- Emissions data is from 2013.
- EU and US data come from different sources.
- Malta's figures are estimates.
- Washington DC is excluded from the list but emits one million metric tons.
Details
Texas and California emit as much as the next six states (Florida, Germany, the United Kingdom, New York, Illinois, and Ohio) combined. Out of the top ten emitting states, only two (Germany and the United Kingdom) are from the EU. The ten least emitting states include only three (Vermont, Rhode Island, and Delaware) from the US. Also, half the EU states are in the 20 least emitting states.
The European Union as a whole emits 471,919,069 metric tons of carbon dioxide from transportation sources annually (or just about four times what Texas itself emits). The United States as a whole emits 1,739,300,000 metric tons of carbon dioxide from transportation sources annually (or about 20 times what Germany emits).
Sources
Eurostat. 2018. "Eurostat - Data Explorer: Air Emissions Accounts." Accessed April 17, 2018. http://appsso.eurostat.ec.europa.eu/nui/show.do?query=BOOKMARK_DS-286146_QID_2207DEA6_UID_-3F171EB0&layout=TIME,C,X,0;GEO,L,Y,0;AIRPOL,L,Z,0;NACE_R2,L,Z,1;UNIT,L,Z,2;INDICATORS,C,Z,3;&zSelection=DS-286146INDICATORS,OBS_FLAG;DS-286146UNIT,T;DS-286146NACE_R2,H;DS-286146AIRPOL,CO2;&rankName1=UNIT_1_2_-1_2&rankName2=AIRPOL_1_2_-1_2&rankName3=INDICATORS_1_2_-1_2&rankName4=NACE-R2_1_2_-1_2&rankName5=TIME_1_0_0_0&rankName6=GEO_1_2_0_1&sortC=ASC_-1_FIRST&rStp=&cStp=&rDCh=&cDCh=&rDM=true&cDM=true&footnes=false&empty=false&wai=false&time_mode=NONE&time_most_recent=false&lang=EN&cfo=%23%23%23%2C%23%23%23.%23%23%23.
United States Department of Transportation. 2015. "State Transportation by the Numbers." Accessed March 21, 2018. https://www.bts.gov/sites/bts.dot.gov/files/legacy/_entire.pdf.