Unemployment Ratios in EU and US Regions, December 2018
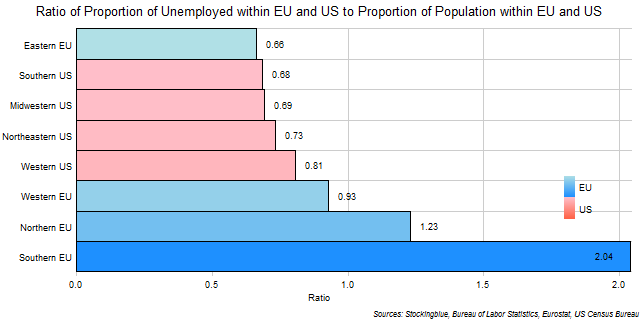
The chart above shows the ratio of the region's proportion of unemployed people in the EU and US to the region's proportion of total people in the EU and US. The Southern EU's unemployed population as a share of the total unemployed population in the EU and the US is twice as large as its total population's share of the total population in the EU and the US.
Unemployment Ratios in EU Regions, December 2018

The chart above shows the ratio of the region's proportion of unemployed people in the EU to the region's proportion of total people in the EU. The Southern EU makes up a disproportionate amount of the Union's unemployed.
Unemployment Ratios in US Regions, December 2018

The chart above shows the ratio of the region's proportion of unemployed people in the US to the region's proportion of total people in the US. Ratios are relatively even across all US regions.
EU and US Regional Unemployment Rates, December 2018
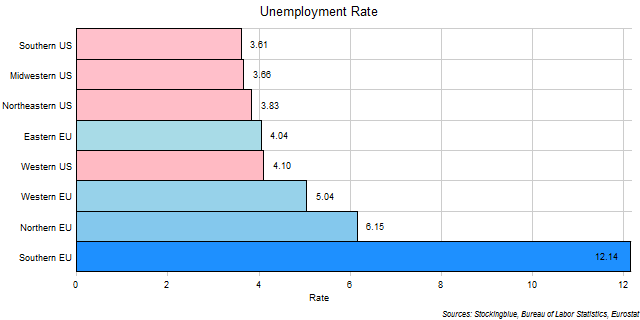
The chart above shows the unemployment rate in each EU and US region as of December 2018. The Southern EU has nearly double the unemployment rate of the next region.
EU Regional Unemployment Rates, December 2018

The chart above shows the unemployment rate in each EU region as of December 2018. The Southern EU really stands out with its extraordinary rate.
US Regional Unemployment Rates, December 2018

The chart above shows the unemployment rate in each US region as of December 2018. The South has the lowest unemployment rate.
Unemployment Ratios in the EU and the US, December 2018
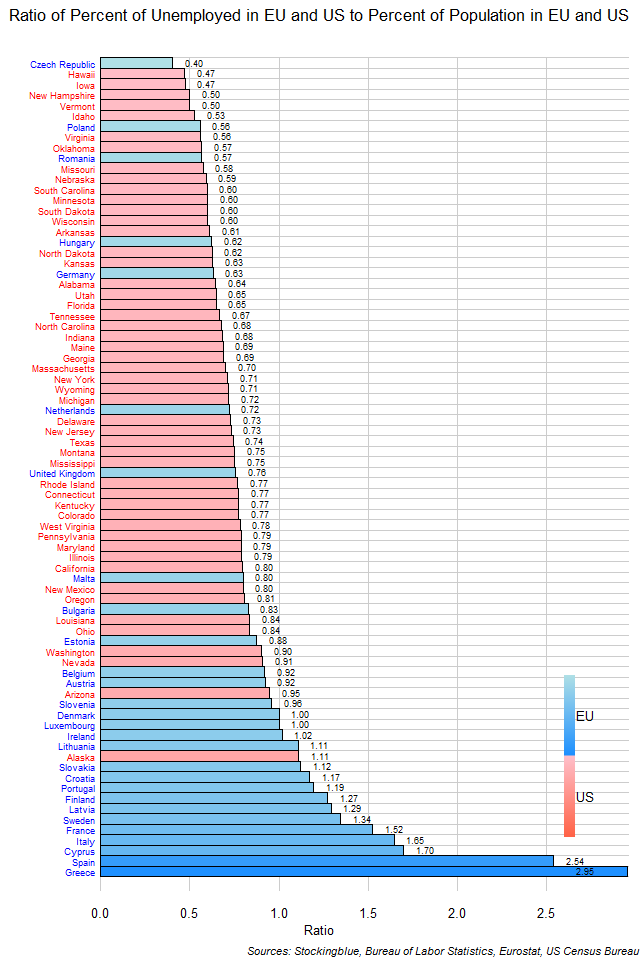
The chart above shows the ratio of the state's proportion of unemployed people in the EU and the US to the state's proportion of total people in the EU and the US. Fourteen states have an unemployed population that makes up a larger proportion of the EU and US total than their total population does. Thirteen of these states are from the EU. The only US state that has a greater proportion of unemployed than total population is Alaska.
Ratio of US States' Unemployed within the US to Total Population within the US, December 2018
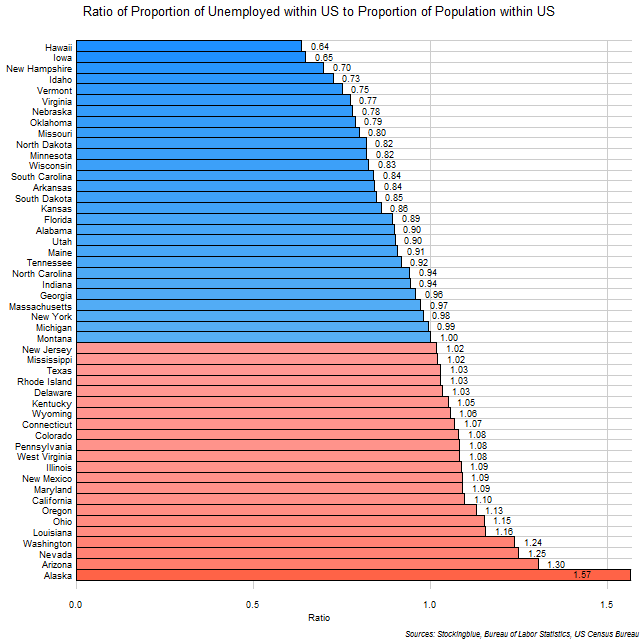
The chart above shows the ratio of the state's proportion of unemployed people in the US to the state's proportion of total people in the US. Twenty-two states have an unemployed population that makes up a larger proportion of the US total than their total population does. For instance, Arizona's unemployed account for 2.70% of the total unemployed people in the US whereas Arizona's population only accounts for 2.07% of the total US population, thus its ratio of unemployed within the US to total people within the US is 1.30.
Ratio of EU States' Unemployed within the EU to Total Population within the EU, December 2018
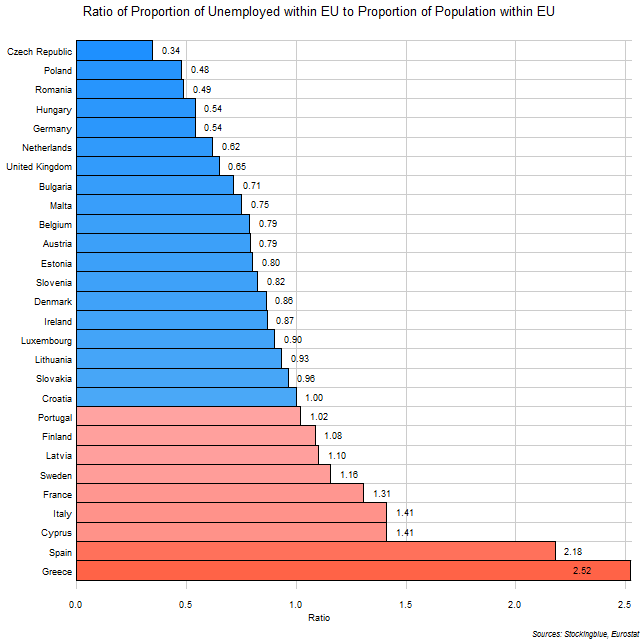
The chart above shows the ratio of the state's proportion of unemployed people in the EU to the state's proportion of total people in the EU. Nine states have an unemployed population that makes up a larger proportion of the EU total than their total population does. For instance, Spain's unemployed account for 20.05% of the total unemployed people in the EU whereas Spain's population only accounts for 9.20% of the total EU population, thus its ratio of unemployed within the EU to total people within the EU is 2.18, or its unemployed population accounts for over twice as much of the EU total than its total population does.
EU and US Unemployment Rates, December 2018
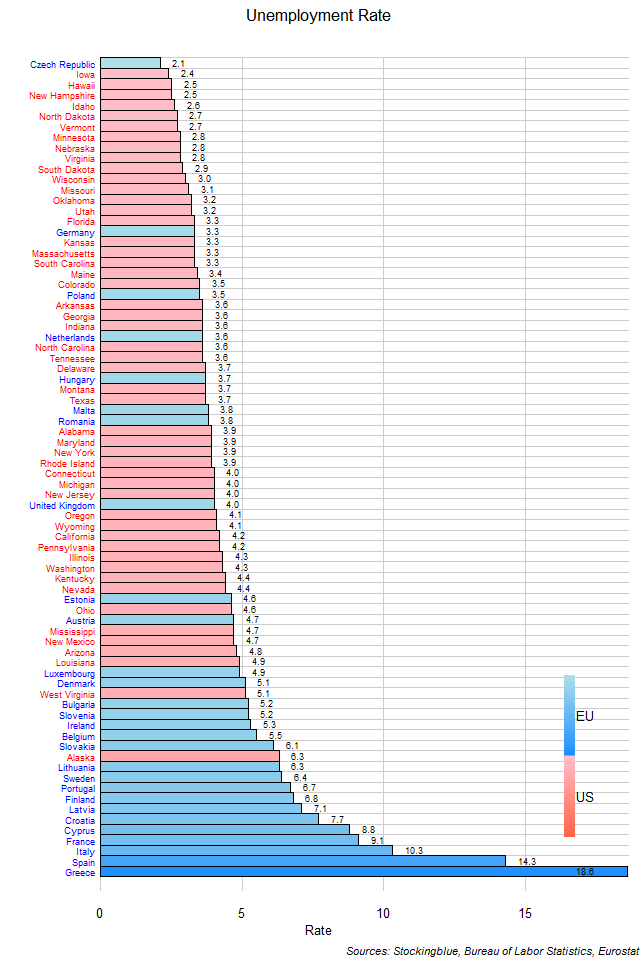
The chart above shows the unemployment rate in each EU and US state as of December 2018 (unless otherwise noted). Although the EU has the state with the lowest unemployment rate, it also has the states with the highest.
OlderNewer