Vehicles per Mile of Roads in US Regions

The chart above shows the number of motor vehicles in US regions by mile of roads. Although the Northeast has the lowest rate of vehicles per residents and the Midwest the highest, in this metric the results are reversed.
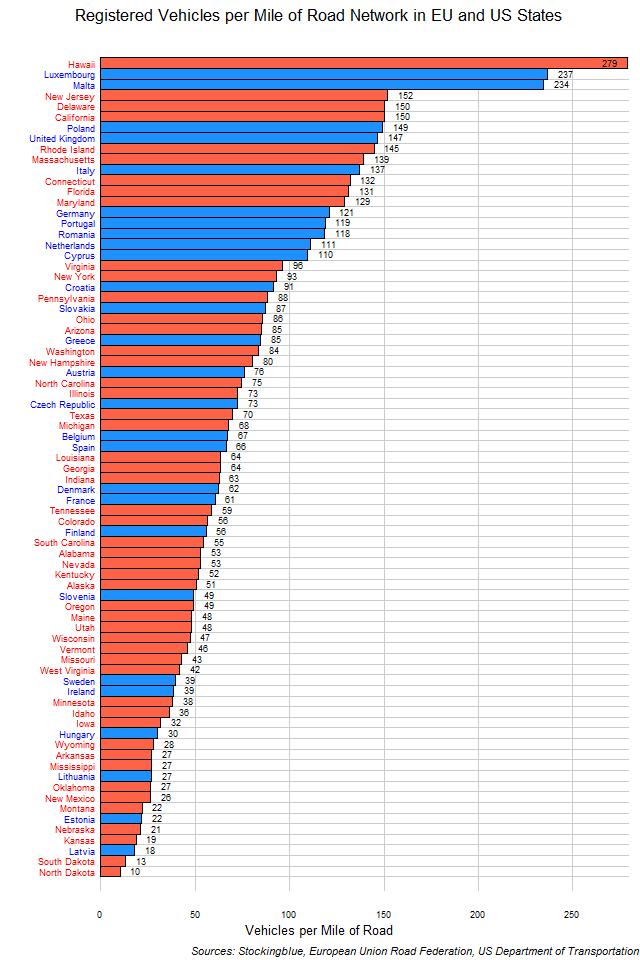
Vehicles per Mile of Roads in EU and US States

The chart above shows the number of motor vehicles in EU and US states by mile of roads. Some of the smallest states have the highest ratio of vehicles to roads but in the EU, small states also have some of the lowest ratios of vehicles to roads.
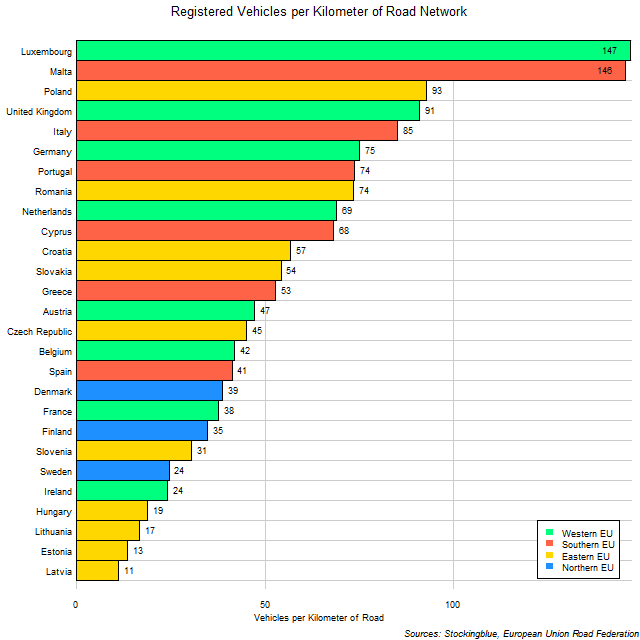
Vehicles per Kilometer of Roads in the EU

The chart above shows the number of motor vehicles in EU states by kilometer of roads. Luxembourg and Malta are the only two states with over 100 vehicles per kilometer of road.
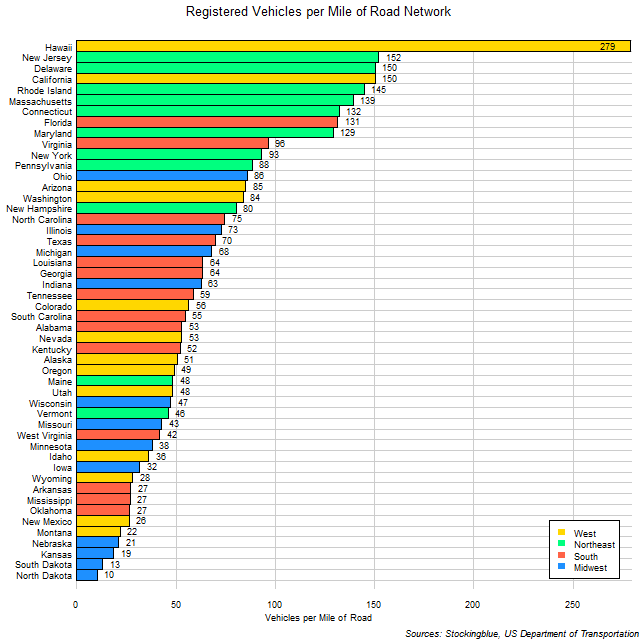
Vehicles per Mile of Roads in the US

The chart above shows the number of motor vehicles in US states by mile of roads. Hawaii has the most vehicles by far per mile of road than any other state and assuming that each of the vehicles were a mid-sized passenger car (about 15 feet in length) and placed front to end in a line the state has eight-tenths of a mile of vehicles for every mile of road.
Newer