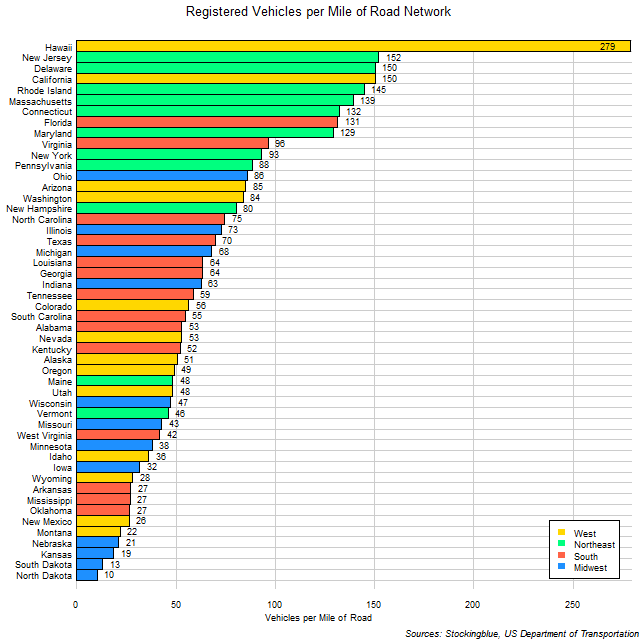
The chart above shows the number of motor vehicles in US states by mile of roads. Hawaii has the most vehicles by far per mile of road than any other state and assuming that each of the vehicles were a mid-sized passenger car (about 15 feet in length) and placed front to end in a line the state has eight-tenths of a mile of vehicles for every mile of road.
Findings
- The difference between the state with the most vehicles per mile, Hawaii, and the state with the least, North Dakota, is 269 vehicles per mile of road.
- Hawaii has 27 times the number of vehicles per mile of road that North Dakota does.
- Nine states have at least 100 vehicles per mile of road.
- The mean rate of vehicles per mile for the US is 70.44 and the median 55.50.
Caveats
- Ownership and road length data is from 2015.
- Total vehicles include automobiles, taxis, buses, trucks, and motorcycles of both public and private use.
Details
Nine states have a third of a mile or more of vehicles (assuming a conservative vehicular length of 15 feet per vehicle - which is pretty low considering that vans, trucks, and buses are included in the vehicle count) per mile of road: Hawaii, New Jersey, Delaware, California, Rhode Island, Massachusetts, Connecticut, Florida, and Maryland.
The rate for the entire United States is 63 vehicles per mile of road which ranks the US as a whole just under Georgia and Louisiana, tied with Indiana, and just above Tennessee.
Sources
United States Department of Transportation. 2016. "Table HM-10M - Highway Statistics 2015 - Policy | Federal Highway Administration." Accessed March 12, 2018. https://www.fhwa.dot.gov/policyinformation/statistics/2015/hm10m.cfm.
United States Department of Transportation. 2018. "Table MV-1 - Highway Statistics 2015." Accessed February 20, 2018. https://www.fhwa.dot.gov/policyinformation/statistics/2015/mv1.cfm.