Long-Term Per Capita GDP by EU and US State, Fourth Quarter 2018
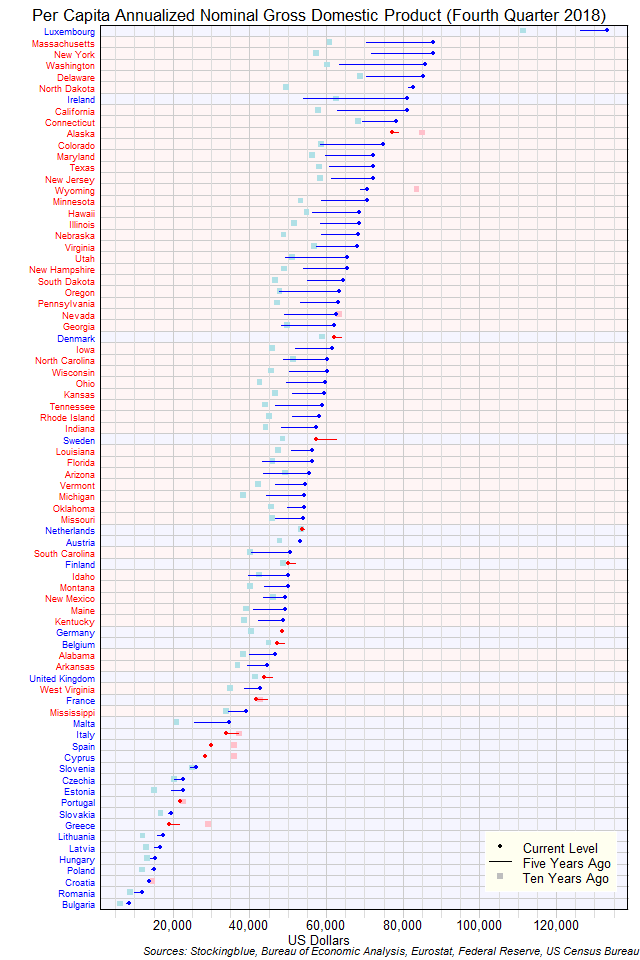
The chart above shows the per capita annualized nominal gross domestic product (GDP) in each EU and US state as of the fourth quarter of 2018 in dollars, the change from five years ago, and the GDP ten years prior. Luxembourg is in a class all by itself.
Long-Term Per Capita GDP by EU State, Fourth Quarter 2018
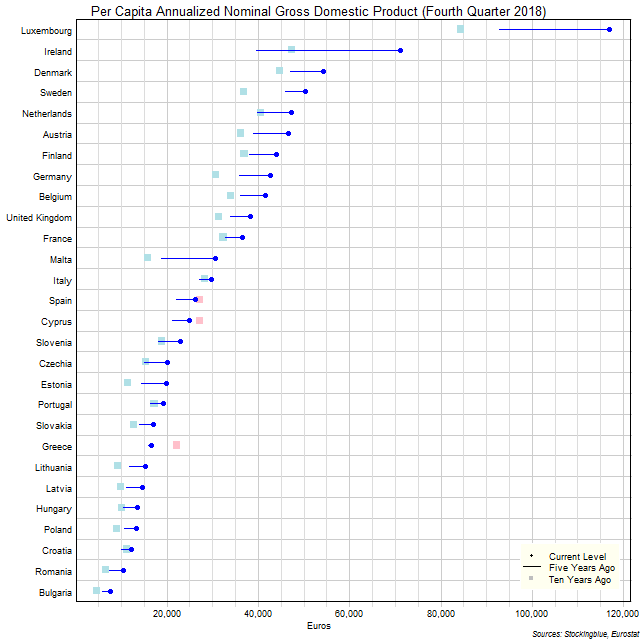
The chart above shows the per capita annualized nominal gross domestic product (GDP) in each EU state as of the fourth quarter of 2018 in euros, the change from five years ago, and the per capita GDP ten years prior. Luxembourg and Ireland had exceptional growth over the past five years.
Per Capita GDP by EU and US State, Fourth Quarter 2018
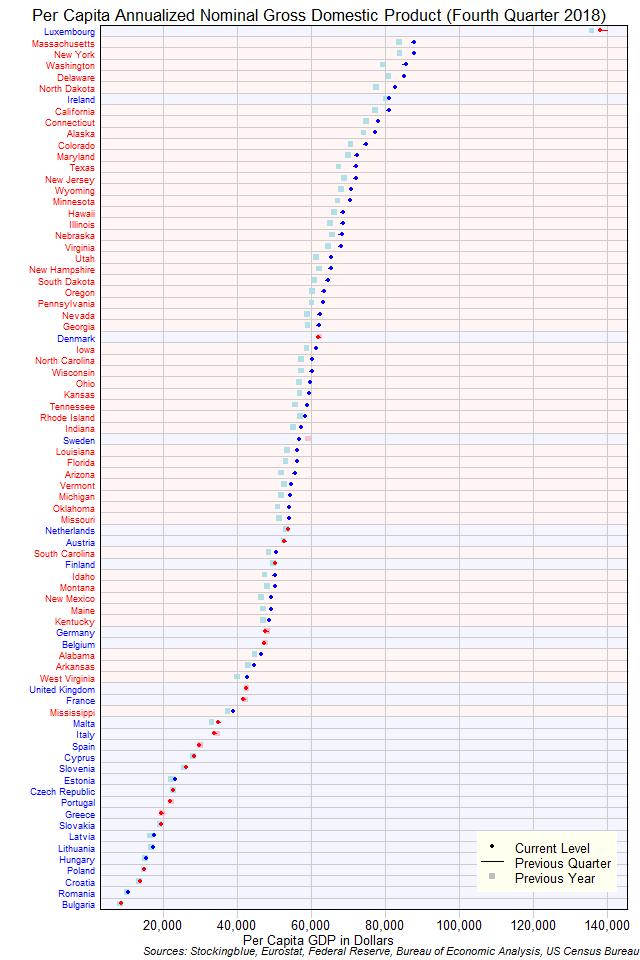
The chart above shows the per capita annualized nominal gross domestic product (GDP) in each EU and US state as of the fourth quarter of 2018 in dollars, the change from the previous quarter, and the GDP one year prior. Luxembourg is in a class all by itself.
Per Capita GDP by EU State, Fourth Quarter 2018
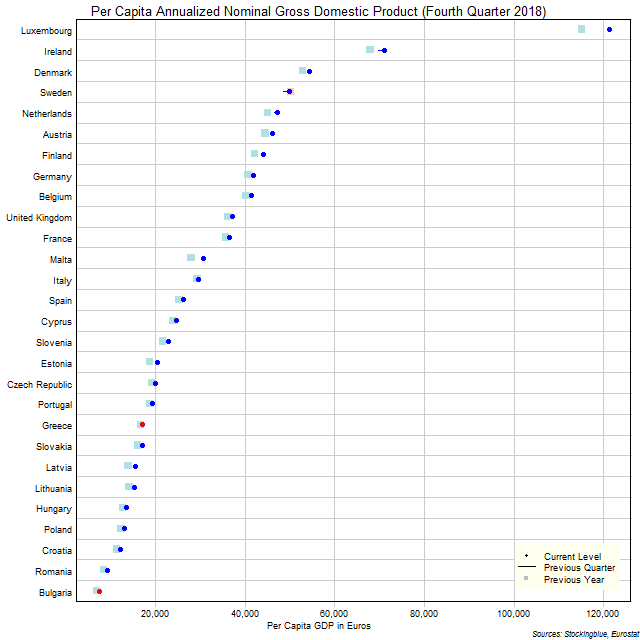
The chart above shows the per capita annualized nominal gross domestic product (GDP) in each EU state as of the fourth quarter of 2018 in euros, the change from the previous quarter, and the GDP one year prior. Luxembourg has at least double the per capita GDP of every other EU state save for Ireland.
Per Capita GDP by US State, Fourth Quarter 2018
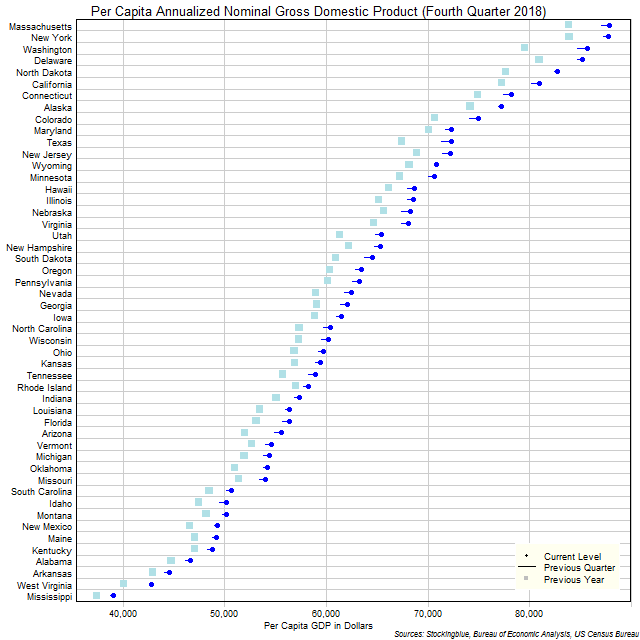
The chart above shows the per capita annualized nominal gross domestic product (GDP) in each US state as of the fourth quarter of 2018 in dollars, the change from the previous quarter, and the GDP one year prior. Every single state's per capita GDP grew both over the past quarter and the past year.
Per Capita Transportation-Based Carbon Dioxide Emissions in EU and US Regions
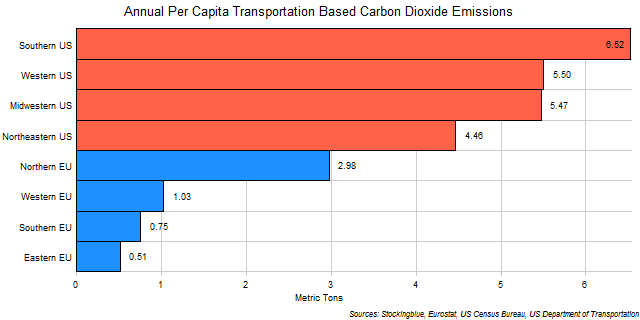
The chart above shows transportation-based carbon dioxide emissions broken down by population in EU and US regions. Every single US region emits more transportation-based carbon dioxide per capita than any EU region.
Per Capita Transportation-Based Carbon Dioxide Emissions in US Regions

The chart above shows transportation-based carbon dioxide emissions broken down by population in US regions. The South emits the most out of all the regions but the differences between the regions are not all that high.
Per Capita Transportation-Based Carbon Dioxide Emissions in EU Regions

The chart above shows transportation-based carbon dioxide emissions broken down by population in EU regions. The Northern EU emits more carbon dioxide per person than all the other three regions combined.
Per Capita Transportation-Based Carbon Dioxide Emissions in EU and US States
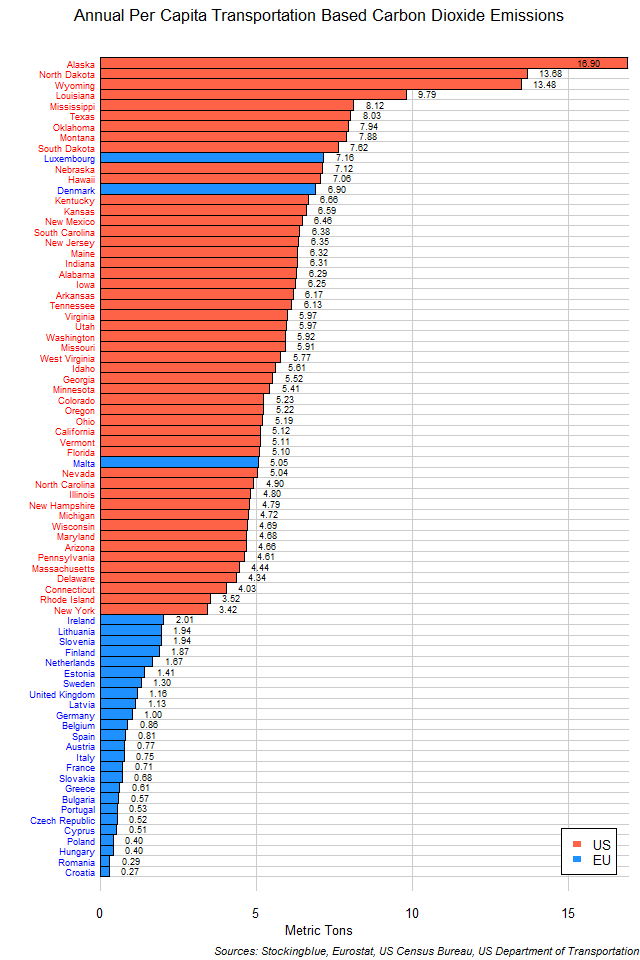
The chart above shows transportation-based carbon dioxide emissions broken down by population in EU and US states. With the exceptions of Luxembourg, Denmark, and Malta, every other EU state emits less carbon dioxide than every single US state.
Per Capita Transportation-Based Carbon Dioxide Emissions in EU States
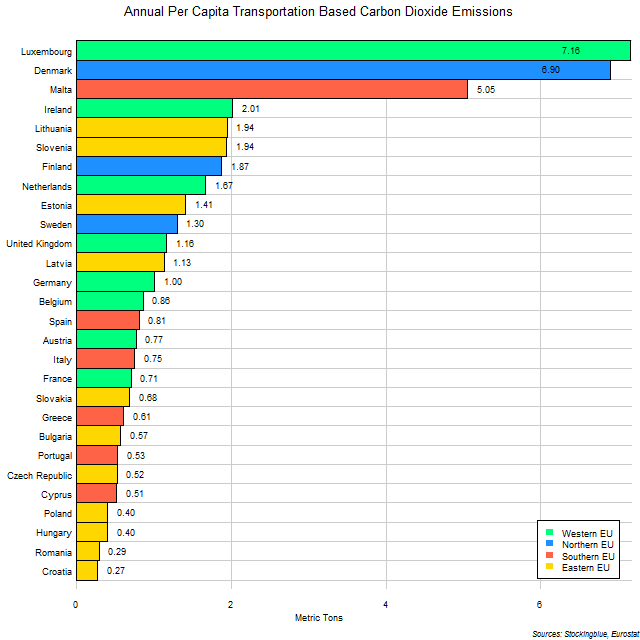
The chart above shows transportation-based carbon dioxide emissions broken down by population in EU states. Three states (Luxembourg, Denmark, and Malta) really stand out having at least 2.5 times the emissions that fourth place Ireland has.
OlderNewer