Per Capita Rail Coverage in EU and US Regions
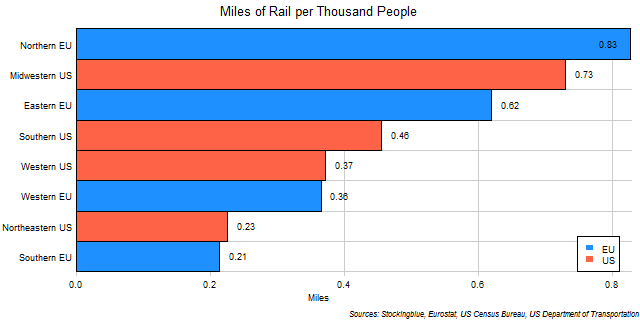
The chart above shows miles of rail per thousand people in EU and US regions. It's rare to see the EU and US regions be so similar to each other. Usually, the regions of one superstate clump together but in this metric there is a weaving back and forth between EU and US regions.
Per Capita Rail Coverage in EU Regions

The chart above shows kilometers of rail per thousand people in EU regions. Only the Northern EU has over one kilometer of track for every thousand people in its region.
Per Capita Rail Coverage in EU States
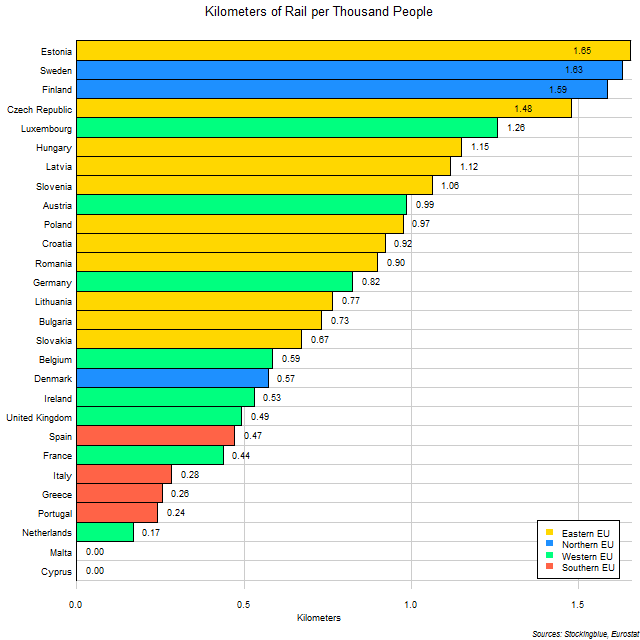
The chart above shows kilometers of rail per thousand people in EU states. Estonia ekes out the top spot surpassing Sweden in kilometers of track per person.
Per Capita Road Coverage in EU Regions

The chart above shows road lengths per thousand people in EU regions. The Northern EU has nearly double the length of roads per person that the Eastern EU has.
Per Capita Road Coverage in EU and US States
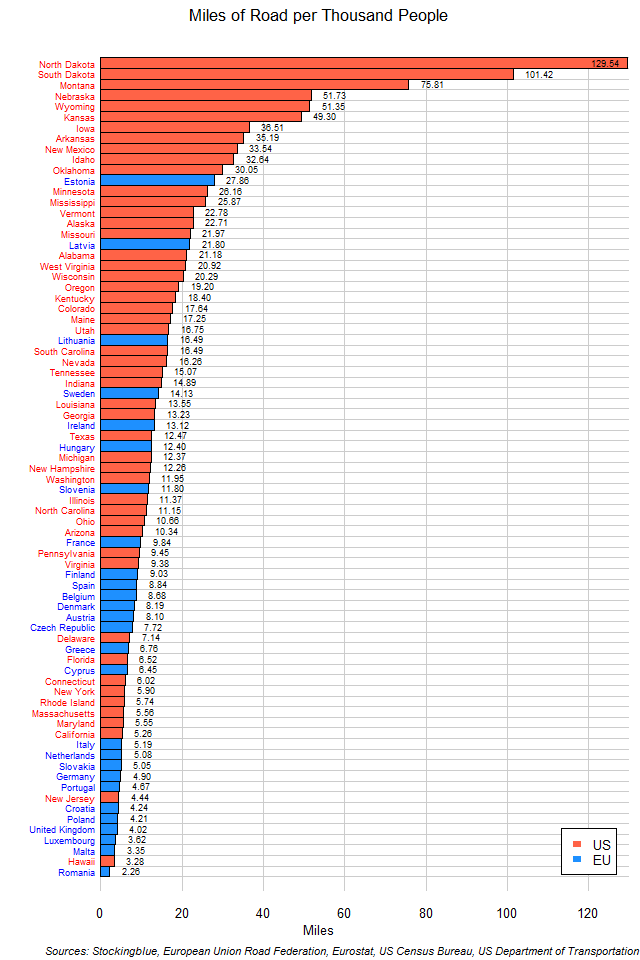
The chart above shows road lengths per thousand people in EU and US states. The top ten states are all from the US with the leading EU state in this metric showing up 12th.
Per Capita Road Coverage in EU States
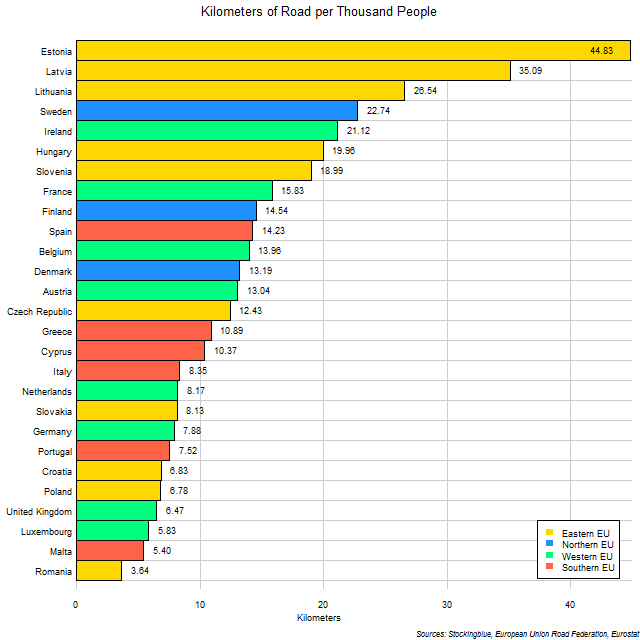
The chart above shows road lengths per thousand people in EU states. The Baltic states dominate in this metric as they have more roads per capita than any other state in the EU. Meanwhile the Southern EU only has one state in the top ten and that is in the tenth spot.
Transportation-Based Carbon Dioxide Emissions for Every Thousand Euros of GDP in EU Regions

The chart above shows transportation-based carbon dioxide emissions broken down by economic output in EU regions. The Northern EU is by far the leading emitter of transportation-based carbon dioxide in this metric.
Transportation-Based Carbon Dioxide Emissions for Every Thousand Euros of GDP in EU States
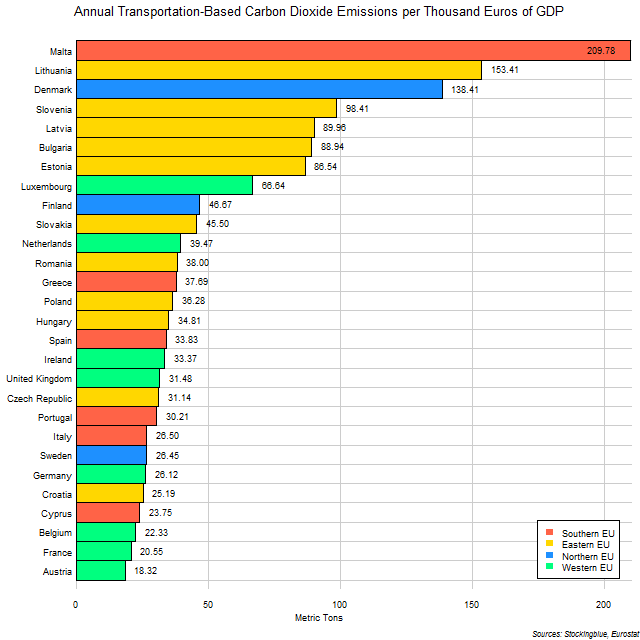
The chart above shows transportation-based carbon dioxide emissions broken down by economic output in EU states. Three out of the top five polluting states in this metric are from the Eastern EU.
Per Capita Transportation-Based Carbon Dioxide Emissions in EU and US Regions
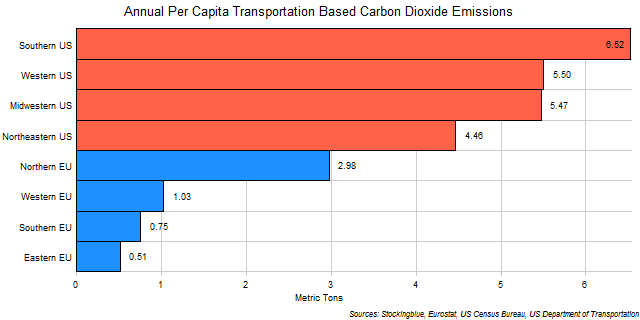
The chart above shows transportation-based carbon dioxide emissions broken down by population in EU and US regions. Every single US region emits more transportation-based carbon dioxide per capita than any EU region.
Per Capita Transportation-Based Carbon Dioxide Emissions in EU Regions

The chart above shows transportation-based carbon dioxide emissions broken down by population in EU regions. The Northern EU emits more carbon dioxide per person than all the other three regions combined.
OlderNewer