US States' Vacation Spending in 2015
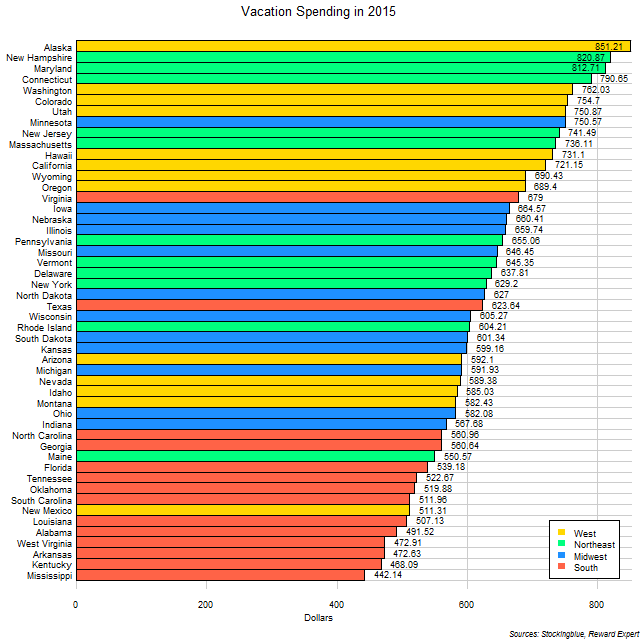
The chart above shows the average vacation expenditures for overnight stays by US state. Western and Northeastern states make up the five largest spenders on vacations.
EU States' Vacation Spending in 2016
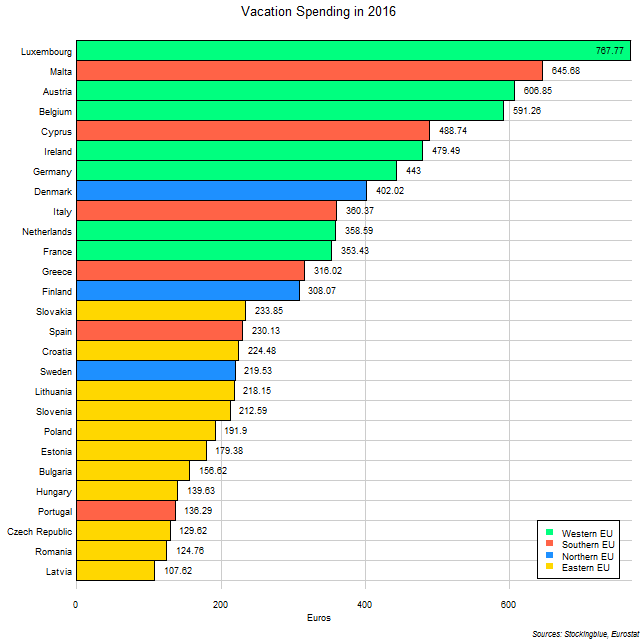
The chart above shows the average vacation expenditures for overnight stays by EU state. Western and Southern EU states make up the five largest spenders on vacations.
Per Capita GDP and Change in Per Capita GDP in EU and US Regions between 2016 and 2017
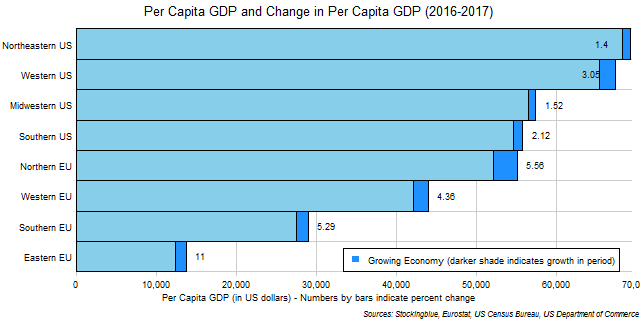
The chart above shows the per capita GDP and change in per capita GDP over the last year in EU and US regions in US dollars. All four US regions have higher per capita GDPs than the four EU regions, however all four EU regions had higher growth rates than all four US regions and if current trends continue, one EU region will overtake one US region this year.
Per Capita GDP and Change in Per Capita GDP in EU Regions between 2016 and 2017

The chart above shows the per capita GDP and change in per capita GDP over the last year in EU regions. The Eastern EU had the highest growth rate in the metric but the Northern EU had the highest overall growth and managed to maintain its lead over all other EU regions.
Per Capita GDP and Change in Per Capita GDP in EU States between 2016 and 2017
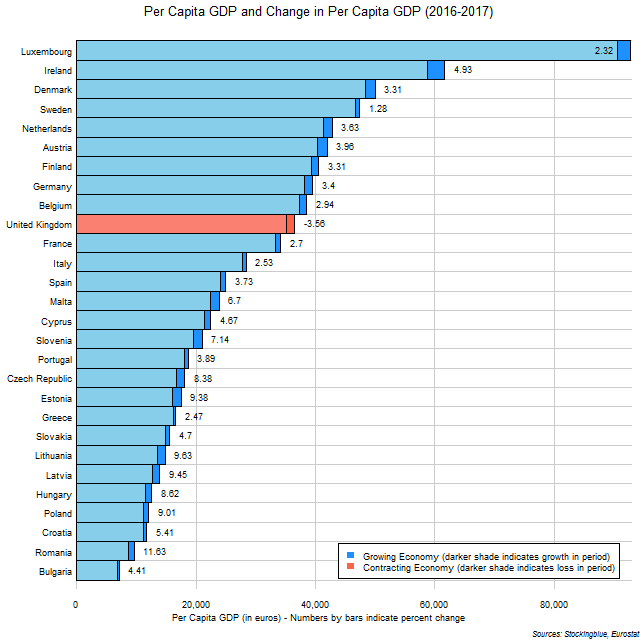
The chart above shows the per capita GDP and change in per capita GDP over the last year in EU states. Luxembourg continues to maintain a commending lead in per capita GDP while Ireland had the greatest growth in the metric last year and Romania had the greatest growth rate.
Per Capita GDP and Change in Per Capita GDP in EU Regions between 2008 and 2017

The chart above shows the per capita GDP and change in per capita GDP over the last ten years in EU regions. In the past ten years, the Northern EU has gone from being one of two regions with a per capita GDP of over €30,000 to the only region with a per capita GDP of over €40,000.
Per Capita GDP and Change in Per Capita GDP in EU and US States between 2008 and 2017
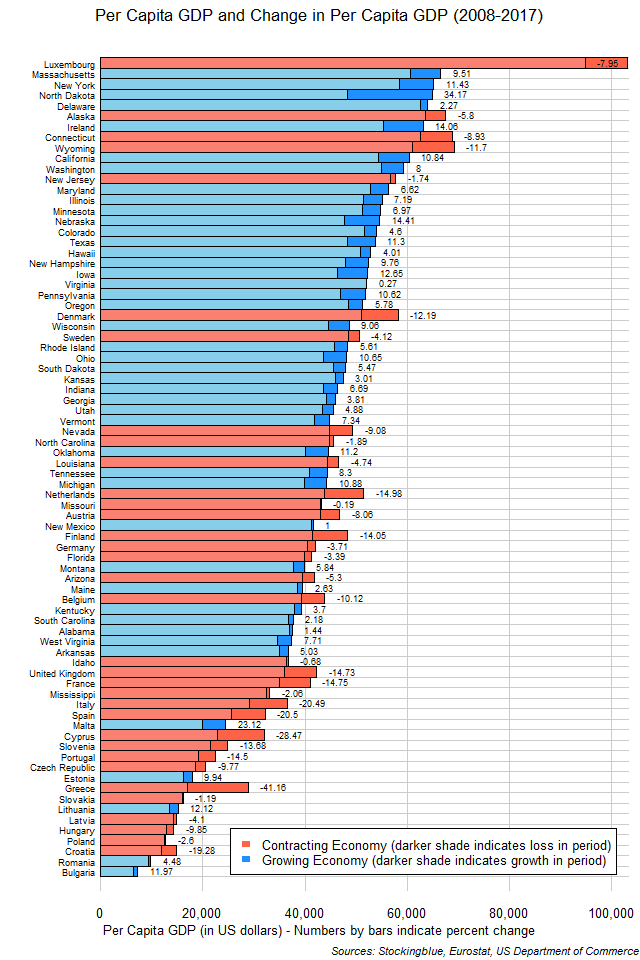
The chart above shows the per capita GDP and change in per capita GDP over the last ten years in EU and US states in US dollars. Luxembourg continues to maintain the highest per capita GDP of all EU and US states by far. However, there are only two other EU states in the top 25 (out of 78): Ireland with the eighth highest per capita GDP and Denmark with the 25th.
Per Capita GDP and Change in Per Capita GDP in EU States between 2008 and 2017
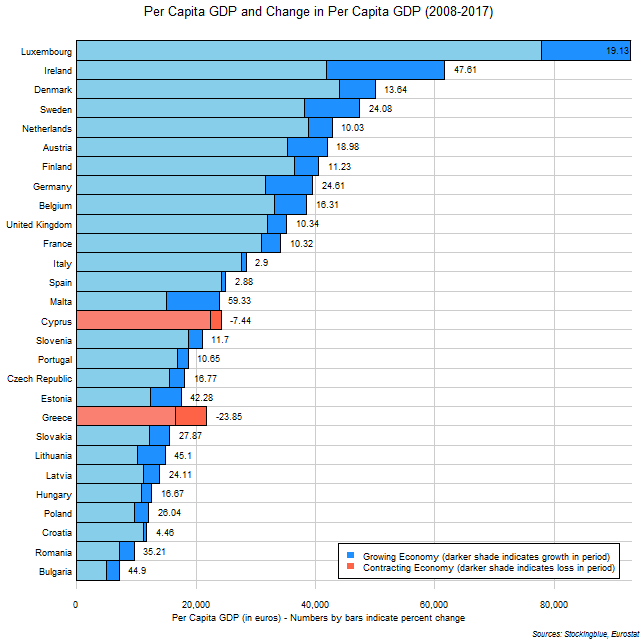
The chart above shows the per capita GDP and change in per capita GDP over the last ten years in EU states. Malta had the largest growth rate but Luxembourg had the greatest absolute growth in the ten-year period. Greece and Cyprus were the only two states whose per capita GDP contracted in the period.
GDP and Change in GDP in EU Regions between 2016 and 2017

The chart above shows the GDP and change in GDP over the last year in EU regions. Although the Eastern EU had the highest growth rate last year at 8.53%, it was the Western EU that had the greatest absolute growth in the Union with a growth of €195,329,300,000 even though it had the lowest growth rate of all the regions.
GDP and Change in GDP in EU and US States between 2016 and 2017
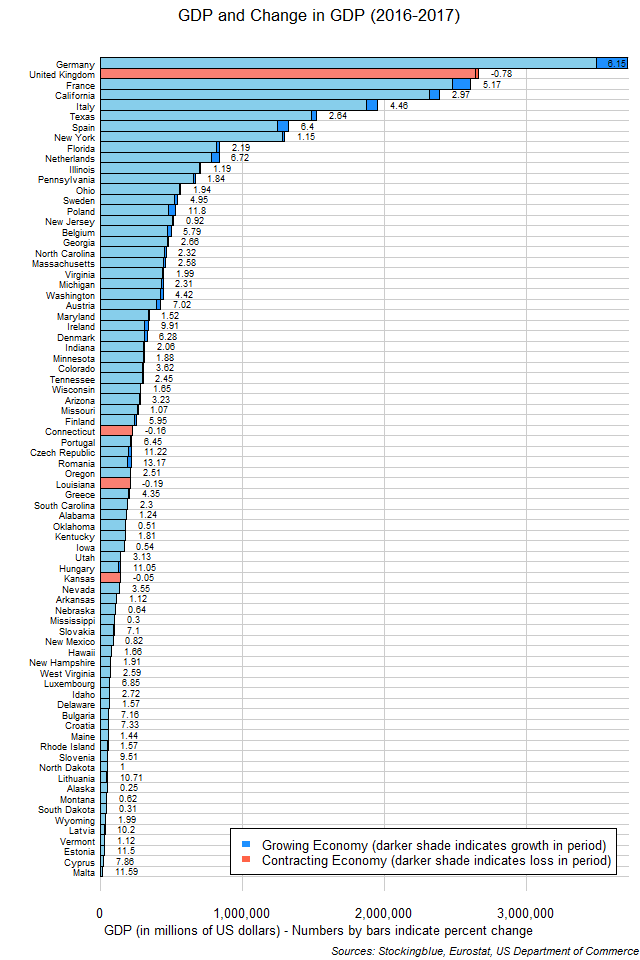
The chart above shows the GDP and change in GDP over the last year in EU and US states in US dollars. Although Germany had less than half the relative growth rate of Romania, it had the largest absolute growth of all the states.
OlderNewer