EU GDP by State, Second Quarter 2020
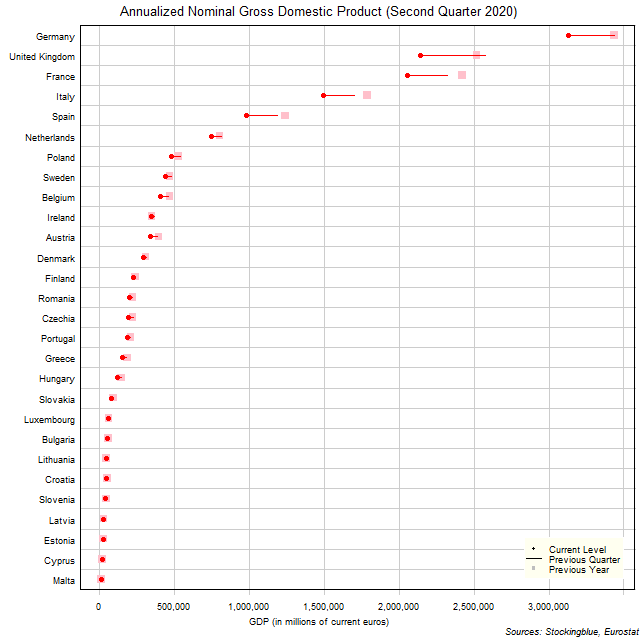
The chart above shows the annualized nominal gross domestic product (GDP) in each EU state as of the second quarter of 2020 in millions of euros, the change from the previous quarter, and the GDP one year prior. Every single state had a decrease in GDP over the previous quarter and over the previous year.
EU and US Regional Unemployment Rates, August 2020
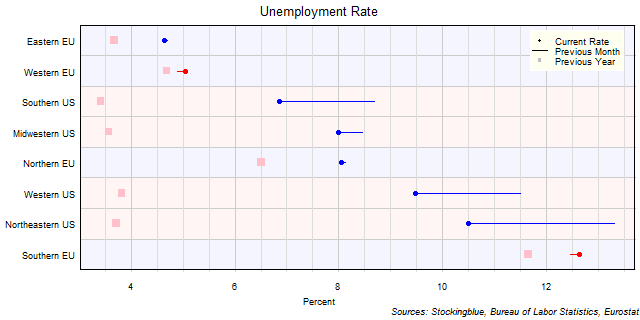
The chart above shows the unemployment rate in each EU and US region as of August 2020 (unless otherwise noted - see caveats below), the change from the previous month, and the rate one year prior. All eight regions have higher rates than they did last year.
EU Regional Unemployment Rates, August 2020

The chart above shows the unemployment rate in each EU region as of August 2020 (unless otherwise noted - see caveats below), the change from the previous month, and the rate one year prior. The Eastern and Northern EU saw an improvement over the previous month.
EU and US Unemployment Rates, August 2020
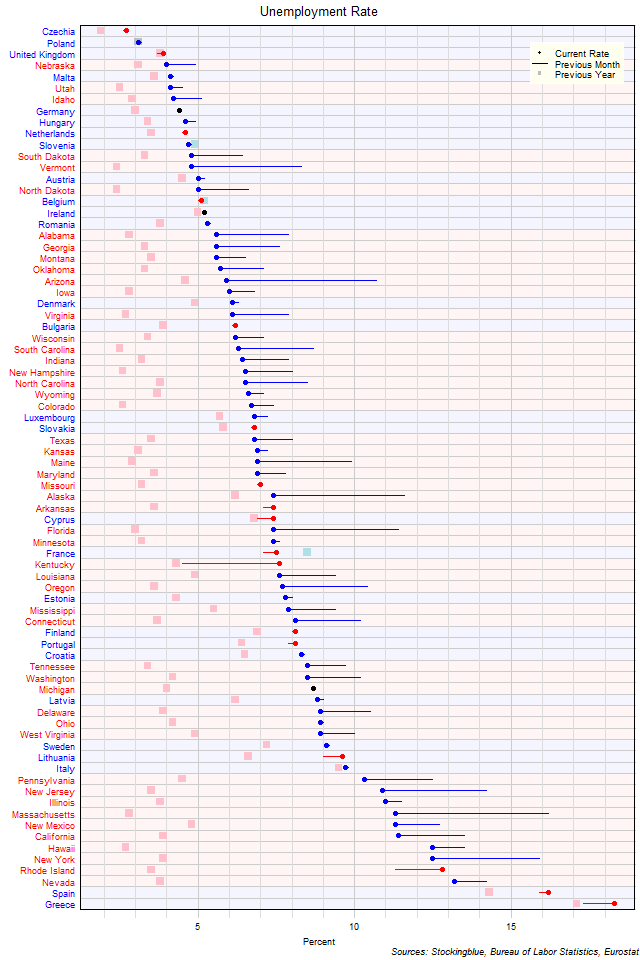
The chart above shows the unemployment rate in each EU and US state as of August 2020 (unless otherwise noted - see caveats below), the change from the previous month, and the rate one year prior. Czechia is the only state with an unemployment rate below three percent. No US states have a rate below three percent.
EU Unemployment Rates, August 2020
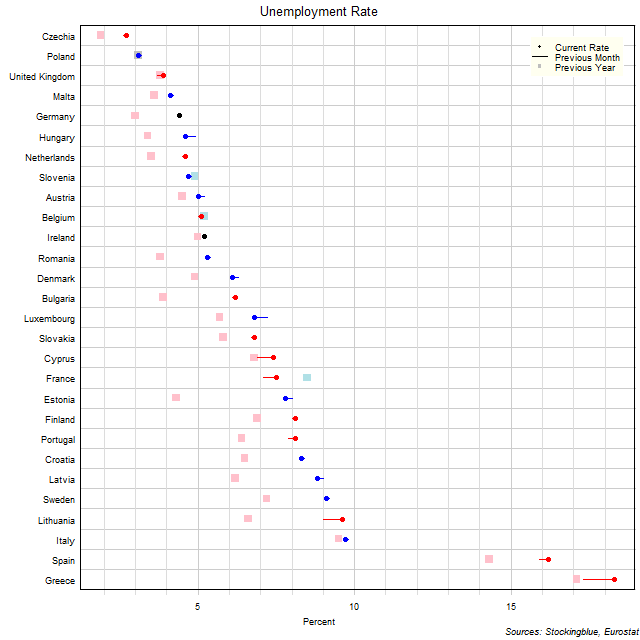
The chart above shows the unemployment rate in each EU state as of August 2020 (unless otherwise noted - see caveats below), the change from the previous month, and the rate one year prior. Czechia is the only state with an unemployment rate below three percent.
EU Long-Term Interest Rates, August 2020
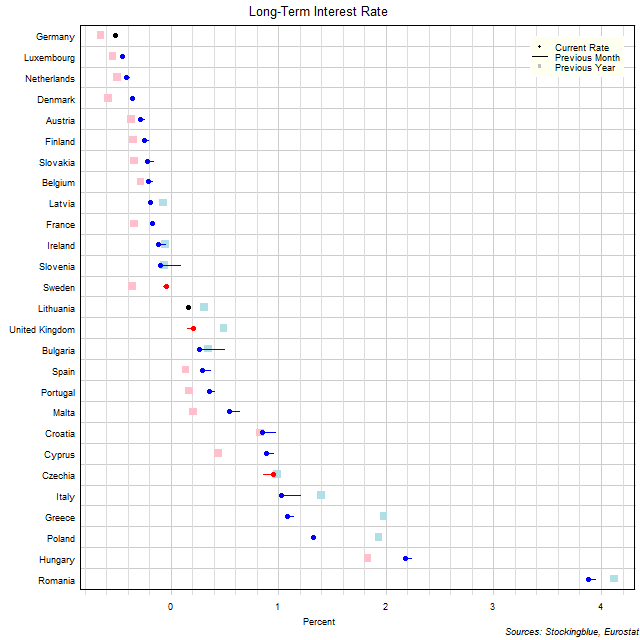
The chart above shows the ten-year interest rate in each EU state as of August 2020, the change from the previous month, and the rate one year prior. Thirteen states have a negative interest rate (up from 12 last month and same as 13 last year).
EU and US Regions by Wooded Area
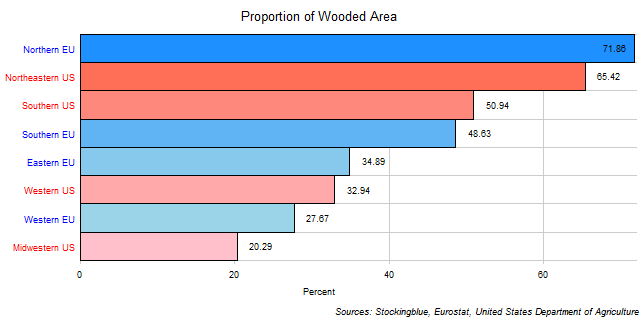
The chart above shows the proportion of each region that is wooded area. Only three regions have over half their territory covered in wood.
EU Regions by Wooded Area

The chart above shows the proportion of each region that is wooded area. The Northern EU has by far the greatest proportion of wooded area.
EU and US States by Wooded Area
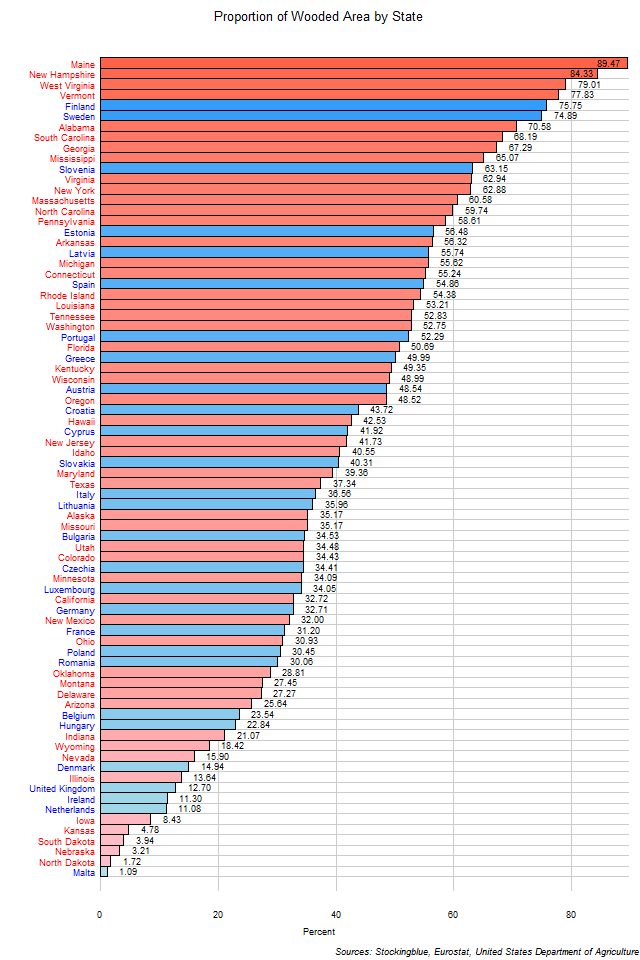
The chart above shows the proportion of each state that is wooded area. Four US states and one EU state have over three-quarters of their land covered in wood.
EU States by Wooded Area
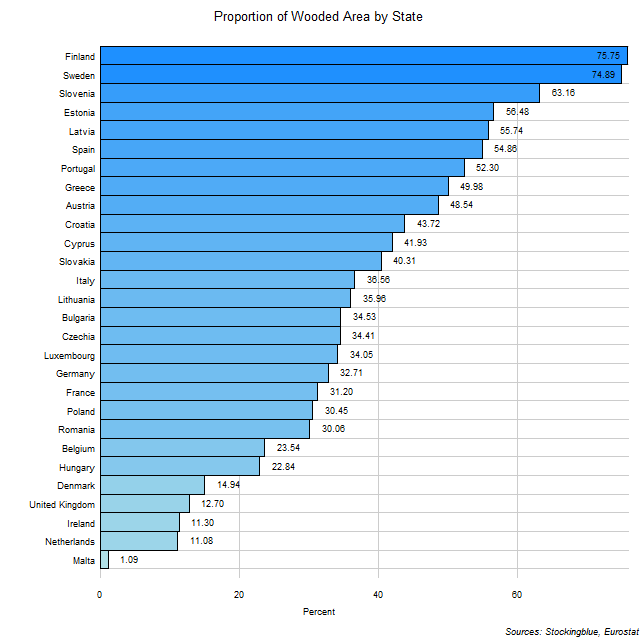
The chart above shows the proportion of each state that is wooded area. Finland has the greatest forest coverage while Malta has almost none.
OlderNewer