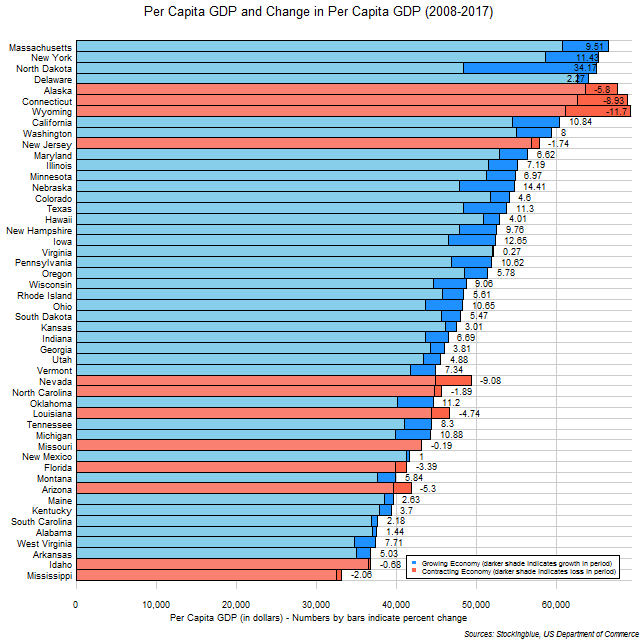
The chart above shows the per capita GDP and change in per capita GDP over the last ten years in US states. North Dakota had both the greatest absolute growth in per capita GDP as well as the greatest growth rate in per capita GDP in the ten year period.
Findings
- The difference between the state with the greatest absolute growth in per capita GDP, North Dakota, and the state with the least, Virginia, is $16,393.
- North Dakota has 118.94 times the per capita absolute economic growth that Virginia does in the past ten years.
- The difference between the state with the greatest growth rate in per capita GDP, North Dakota, and the state with the least, Virginia, is 33.90 percentage points.
- North Dakota has 127.80 times the per capita economic growth rate that Virginia does in the past ten years.
- Wyoming, Connecticut, Nevada, Alaska, Arizona, Louisiana, Florida, New Jersey, North Carolina, Mississippi, Idaho, and Missouri all were states whose per capita GDP shrank in the past ten years.
- Massachusetts and New York surpassed Delaware, Alaska, Connecticut, and Wyoming to become the states with the highest and second highest per capita GDP respectively in the US.
- Mississippi had the lowest per capita GDP both in 2008 and 2017.
Caveats
- All percentages are rounded to the nearest hundredth.
Details
North Dakota is the only state whose total GDP and per capita GDP grew by more than one-third.
The median per capita GDP for the 50 states went from $45,898 in 2008 to $48,096 in 2017 while the mean went from $47,076 to $49,142.
Sources
US Department of Commerce. 2018. "US Bureau of Economic Analysis." Accessed June 26, 2018. https://bea.gov/itable/iTable.cfm?ReqID=70&step=1#reqid=70&step=10&isuri=1&7003=1000&7035=-1&7004=naics&7005=1&7006=01000,02000,04000,05000,06000,08000,09000,10000,11000,12000,13000,15000,16000,17000,18000,19000,20000,21000,22000,23000,24000,25000,26000,27000,28000,29000,30000,31000,32000,33000,34000,35000,36000,37000,38000,39000,40000,41000,42000,44000,45000,46000,47000,48000,49000,50000,51000,53000,54000,55000,56000&7036=-1&7001=11000&7002=1&7090=70&7007=2017,2016,2015,2014,2013,2012,2011,2010,2009,2008,2007,2006&7093=levels.