EU Regional Unemployment Rates, August 2020

The chart above shows the unemployment rate in each EU region as of August 2020 (unless otherwise noted - see caveats below), the change from the previous month, and the rate one year prior. The Eastern and Northern EU saw an improvement over the previous month.
US Regional Unemployment Rates, August 2020

The chart above shows the unemployment rate in each US region as of August 2020, the change from the previous month, and the rate one year prior. All four regions had drastic reductions in the rate over the previous month.
EU and US Unemployment Rates, August 2020
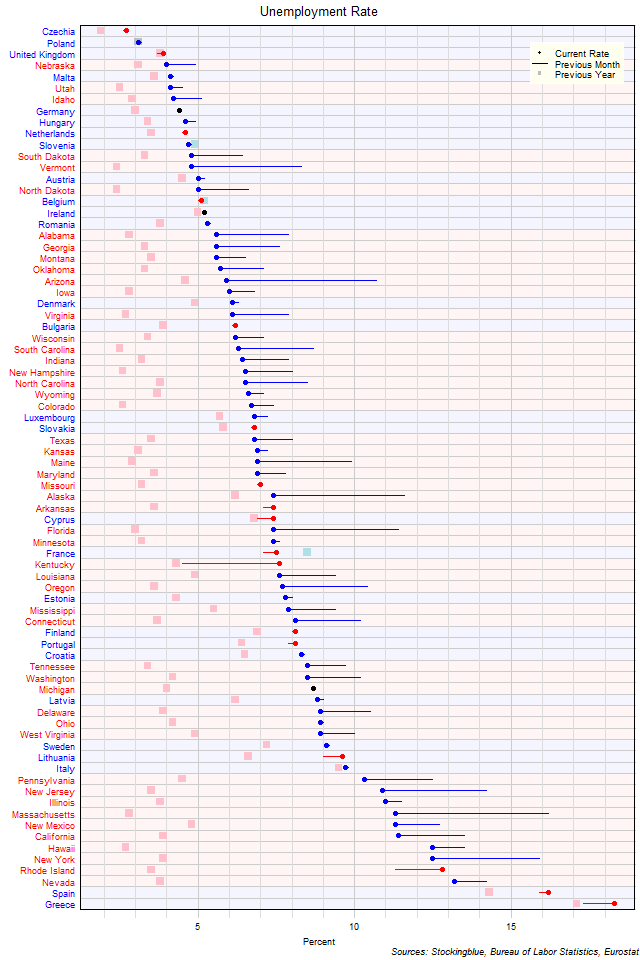
The chart above shows the unemployment rate in each EU and US state as of August 2020 (unless otherwise noted - see caveats below), the change from the previous month, and the rate one year prior. Czechia is the only state with an unemployment rate below three percent. No US states have a rate below three percent.
EU Unemployment Rates, August 2020
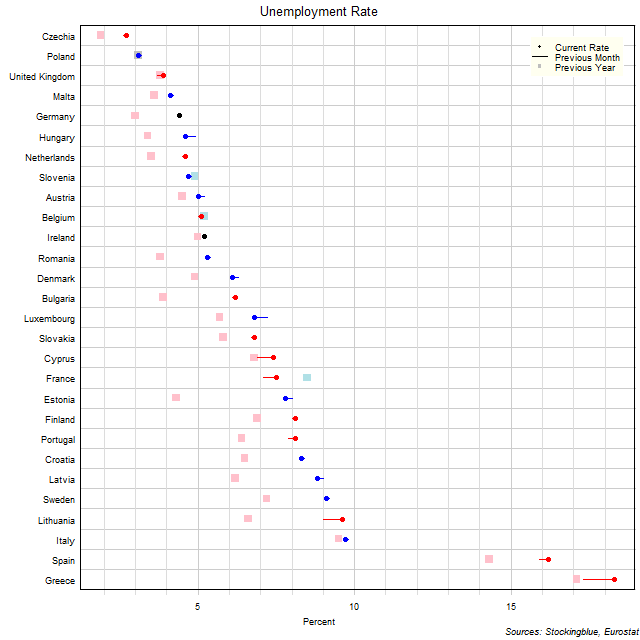
The chart above shows the unemployment rate in each EU state as of August 2020 (unless otherwise noted - see caveats below), the change from the previous month, and the rate one year prior. Czechia is the only state with an unemployment rate below three percent.
US Unemployment Rates, August 2020
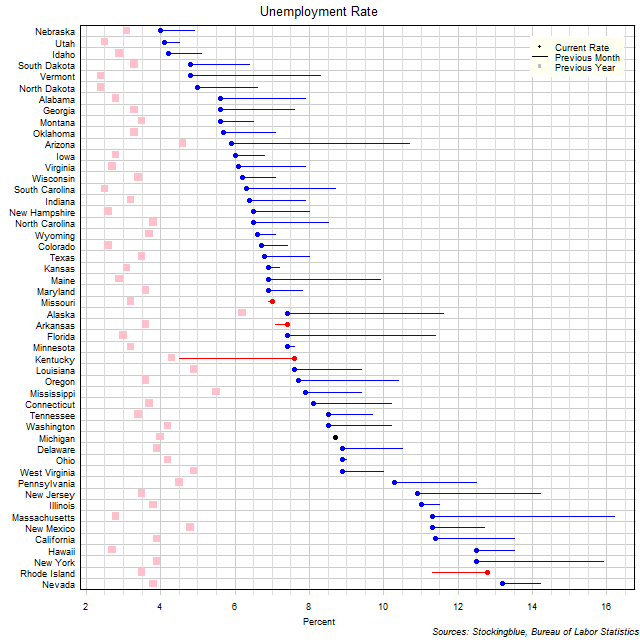
The chart above shows the unemployment rate in each US state as of August 2020, the change from the previous month, and the rate one year prior. The unemployment rate continues to drop in most states resulting in 33 states with an unemployment rate below eight percent.
EU Long-Term Interest Rates, August 2020
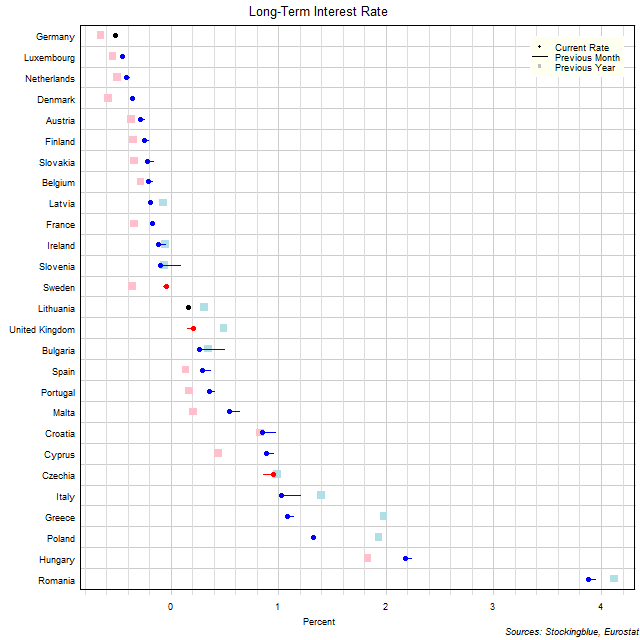
The chart above shows the ten-year interest rate in each EU state as of August 2020, the change from the previous month, and the rate one year prior. Thirteen states have a negative interest rate (up from 12 last month and same as 13 last year).
Treasury Rate Movements, September 2020
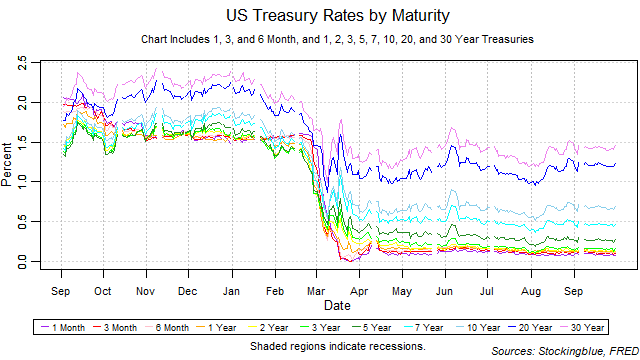
The three-year rate rose, the one-month, one-year, and five-year rates stayed the same, and all other rates dropped in September. The yield curve narrowed from the previous month thus ending its widening streak of one month. The one-month bill maintained the lowest rate throughout the month but shared it with the three-month on one occasion. There were no moves upwards on short-term rates thus decreasing the risk of an inversion brought upon by rising short-term rates. Such an inversion, if it were to happen would be a strong indicator for an upcoming recession.
EU and US Regions by Wooded Area
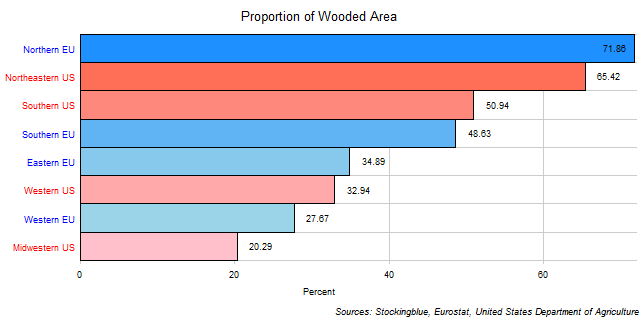
The chart above shows the proportion of each region that is wooded area. Only three regions have over half their territory covered in wood.
EU Regions by Wooded Area

The chart above shows the proportion of each region that is wooded area. The Northern EU has by far the greatest proportion of wooded area.
US Regions by Wooded Area

The chart above shows the proportion of each region that is wooded area. The Northeast has by far the greatest proportion of wooded area.
OlderNewer