EU and US Regions by Population Density
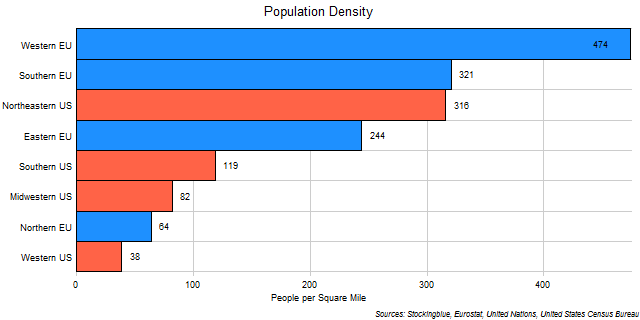
The chart above shows the population density of EU and US regions. The European Union is far more densely populated than the United States having the two most densely populated regions while the United States has three of the four least densely populated regions.
EU and US States by Population Density
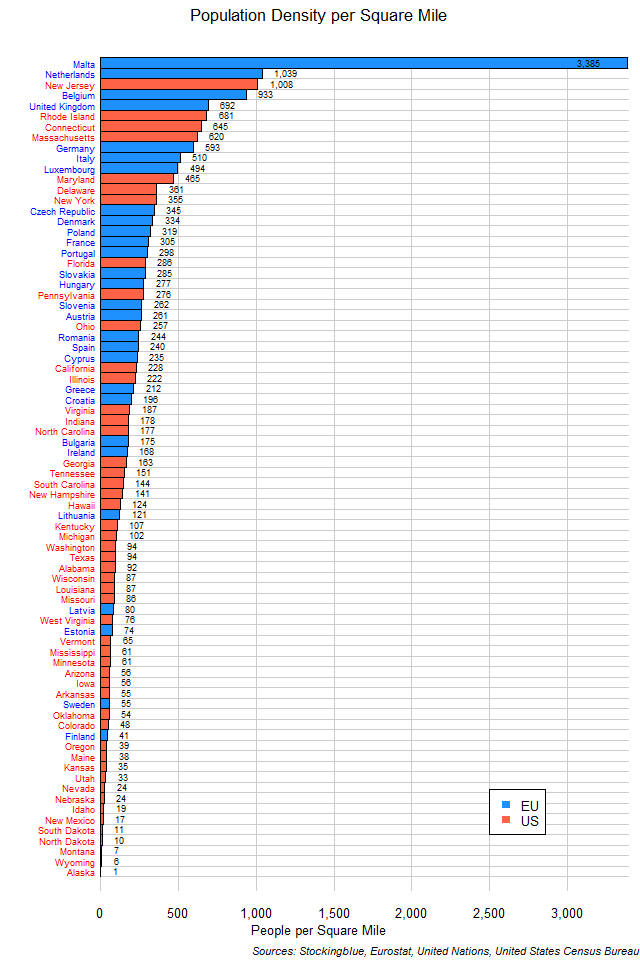
The chart above shows the population density of EU and US states. Not surprisingly, the European Union is much more densely populated than the US is, but what is surprising is how much more densely populated the least densely populated state in the EU is than several US states.
EU and US Regions by Gross Domestic Product per Area
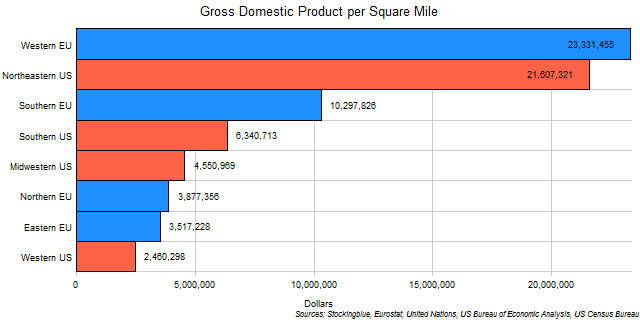
The chart above shows the Purchasing Power Parity Gross Domestic Product (GDP PPP) of EU and US regions per square mile of territory in US dollars. Only three regions produce over $10 million per square mile of territory: the Western EU, the Northeastern US, and the Southern EU; while only the Western EU and the Northeastern US make over $20 million.
EU and US States Ranked by Gross Domestic Product per Area
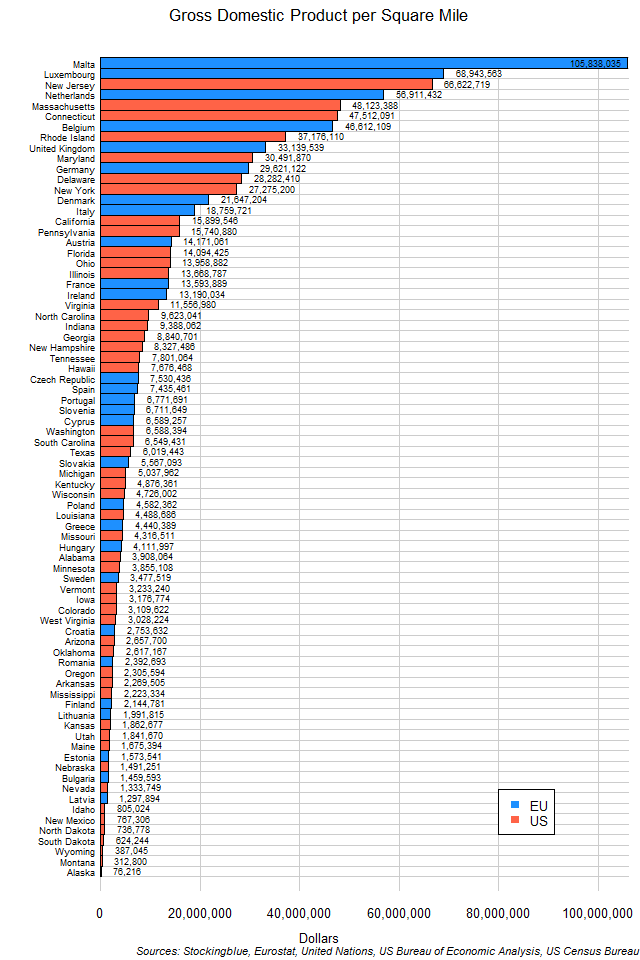
The chart above shows the Purchasing Power Parity Gross Domestic Product (GDP PPP) of EU and US states per square mile of territory in US dollars. EU and US states are distributed pretty much equally in this metric.
EU and US Regions by Area
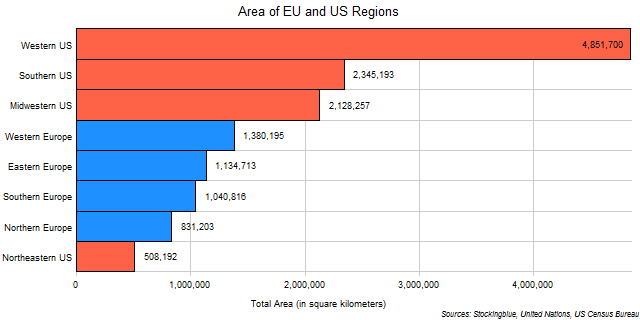
The chart above shows the area of each of the EU and US regions. The Western US is so large that it can fit the entirety of the European Union within it.
Comparison of EU and US States by Area
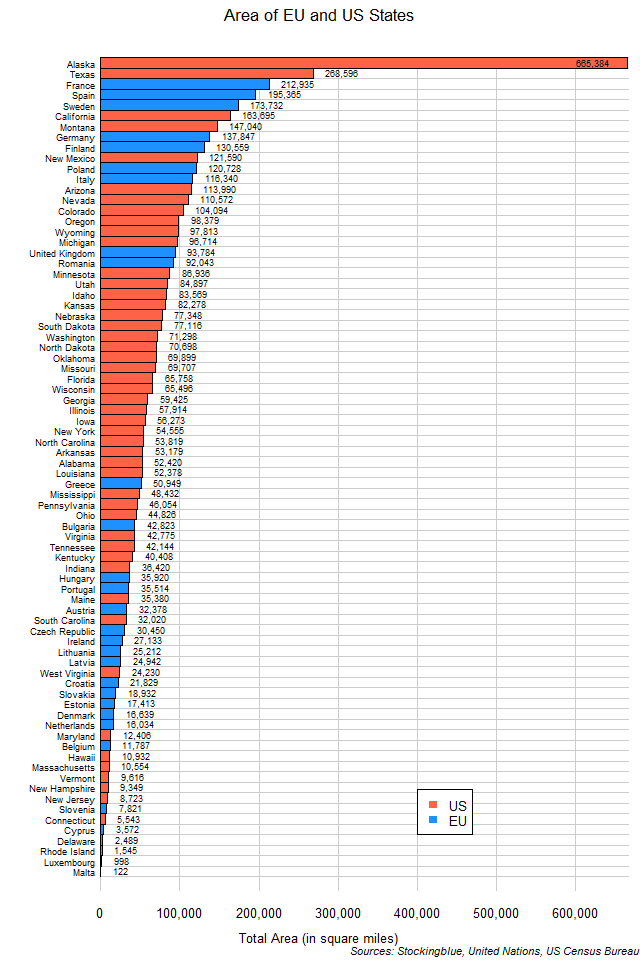
The chart above shows the area of each of the EU and US states. Alaska is so huge that it takes the next three largest states (Texas, France, and Spain) to rival its area.
Regional Populations of the European Union and the United States
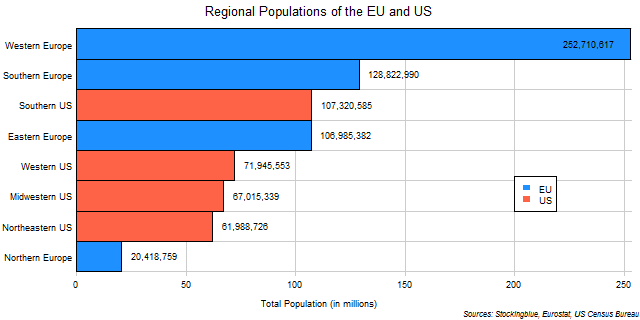
The chart above shows the regional populations of the European Union and the United States. There is a large disparity of population in European regions whereas the population differences are not all that great between American regions.
Proportion of Most Populous Cities in EU and US States
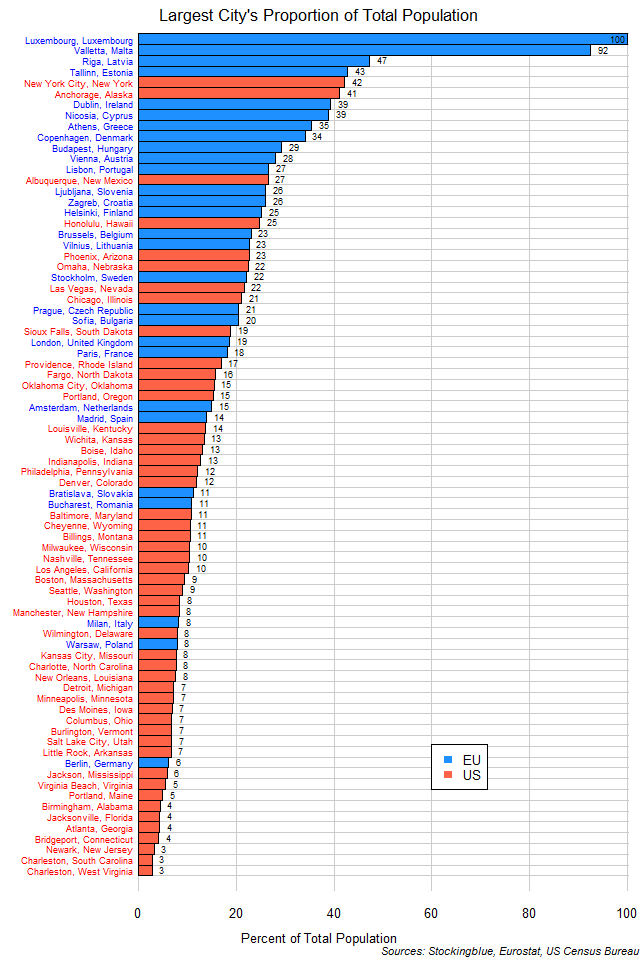
The chart above shows the most populous city in each EU state and the proportion of that nation's population that resides there. EU states tend to have more of their population residing in their largest city than US states do.
Per Capita Gross Domestic Product of EU and US Regions
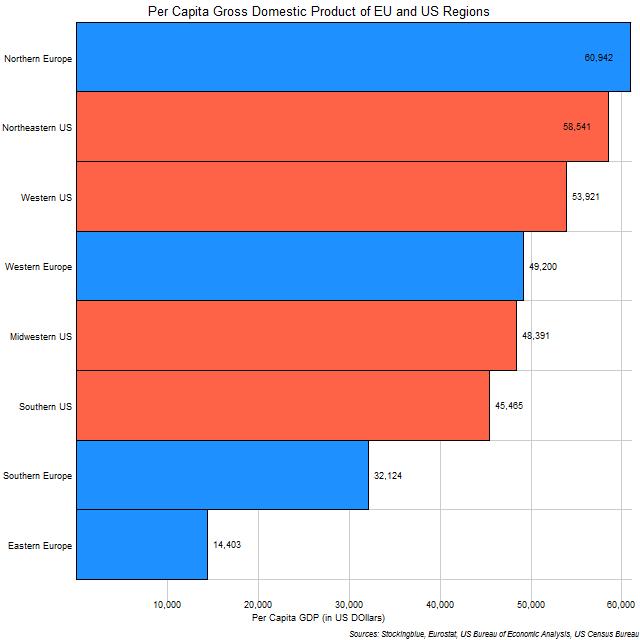
The chart above shows the per capita PPP GDP of EU and US regions. Although Europe has the wealthiest region as measured by the per capita metric, it also has the poorest regions by far.
Per Capita Gross Domestic Product in EU and US States
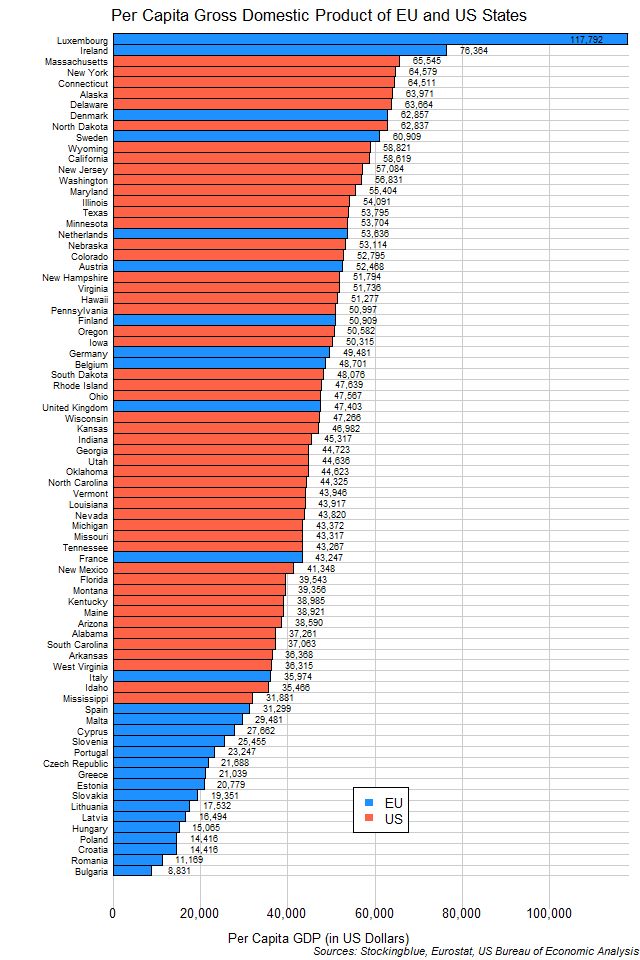
The chart above shows the per capita GDP of EU and US states. Although the EU has the two states with the highest per capita GDP, it also has the 16 states with the lowest per capita GDP.
OlderNewer