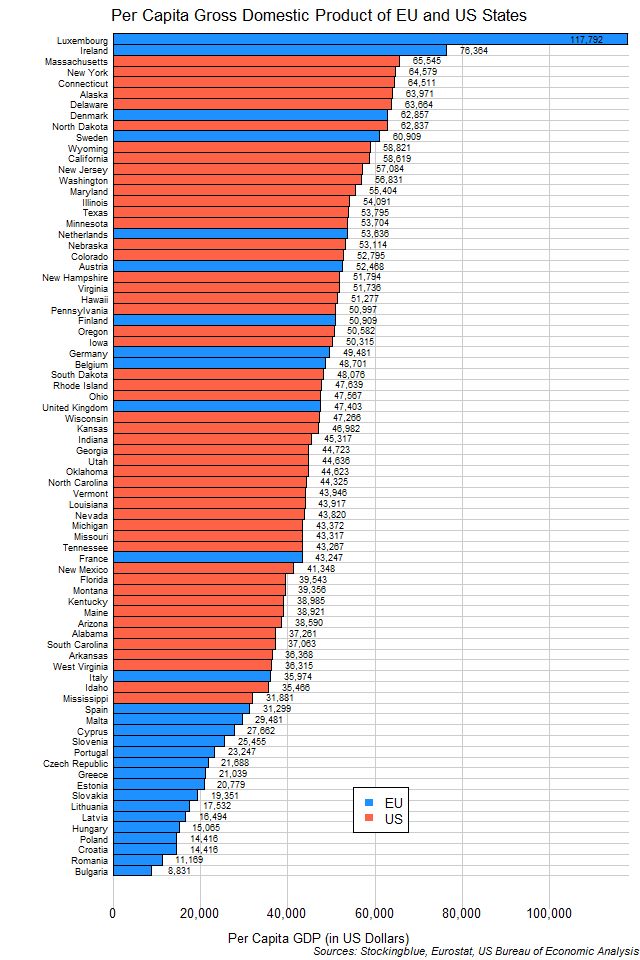
The chart above shows the per capita GDP of EU and US states. Although the EU has the two states with the highest per capita GDP, it also has the 16 states with the lowest per capita GDP.
Findings
- Only Luxembourg has a per capita GDP over $100,000.
- Every single US state has a per capita GDP over $30,000.
- The entirety of Southern and Eastern Europe save for Italy and Spain has a per capita GDP of less than $30,000.
- The entirety of Southern and Eastern Europe save for Italy has a per capita GDP lower than every single US state.
- Luxembourg and Ireland have a per capita GDP higher than every single US state.
- The ratio of richest EU state to poorest EU state is 13.34.
- The ratio of richest US state to poorest US state is 2.07.
Caveats
- The data is from 2016.
- Data for the EU and the US come from two different sources.
- EU data was converted from euros to dollars at the average 2016 0.77 euros to dollars rate.
- The EU does not have 200 years of economic cohesion whereas the US does.
Details
If the EU is to push forward with becoming more united, the economic disparity between countries is something that needs to be addressed. Granted, many of the countries with low per capita GDPs emerged from the Eastern Bloc just over two decades ago but Southern Europe has been integrated economically via trade and treaties with Western Europe for a considerable time before that.
It is not even an issue of rich countries giving up wealth as the wealthiest US states have similar per capita GDPs with the wealthiest EU states (excluding Luxembourg and Ireland) and the US still manages to keep the ratio between rich and poor states so low even though the country spans a greater geography than the EU does.
Sources
Eurostat. 2017. "Gross Domestic Product at Market Prices. Accessed October 26, 2017. http://ec.europa.eu/eurostat/tgm/refreshTableAction.do?tab=table&plugin=1&pcode=tec00001&language=en.
US Bureau of Economic Analysis. 2017. "Regional Data." Accessed October 26, 2017. https://bea.gov/itable/iTable.cfm?ReqID=70&step=1#reqid=70&step=1&isuri=1.