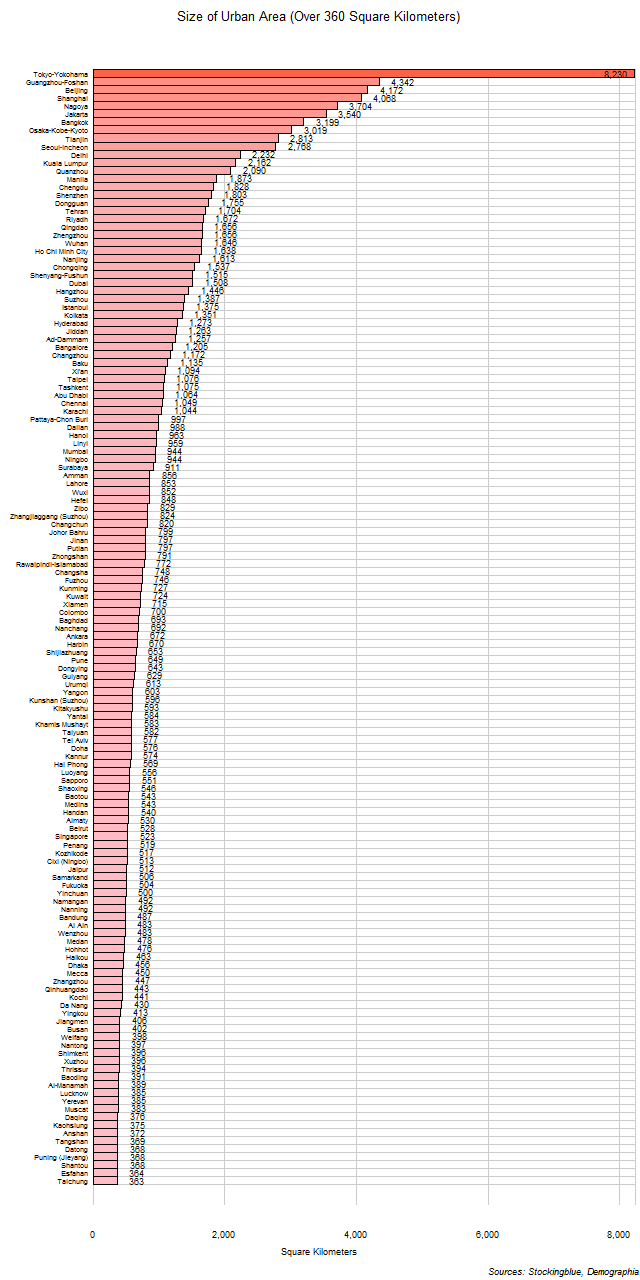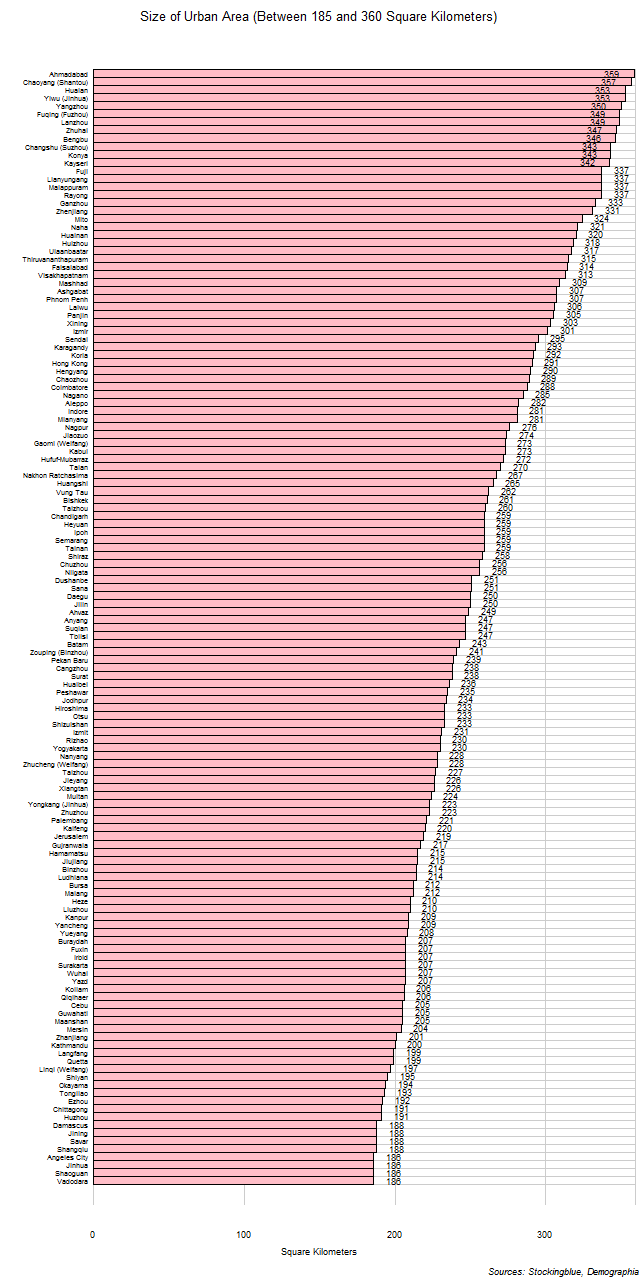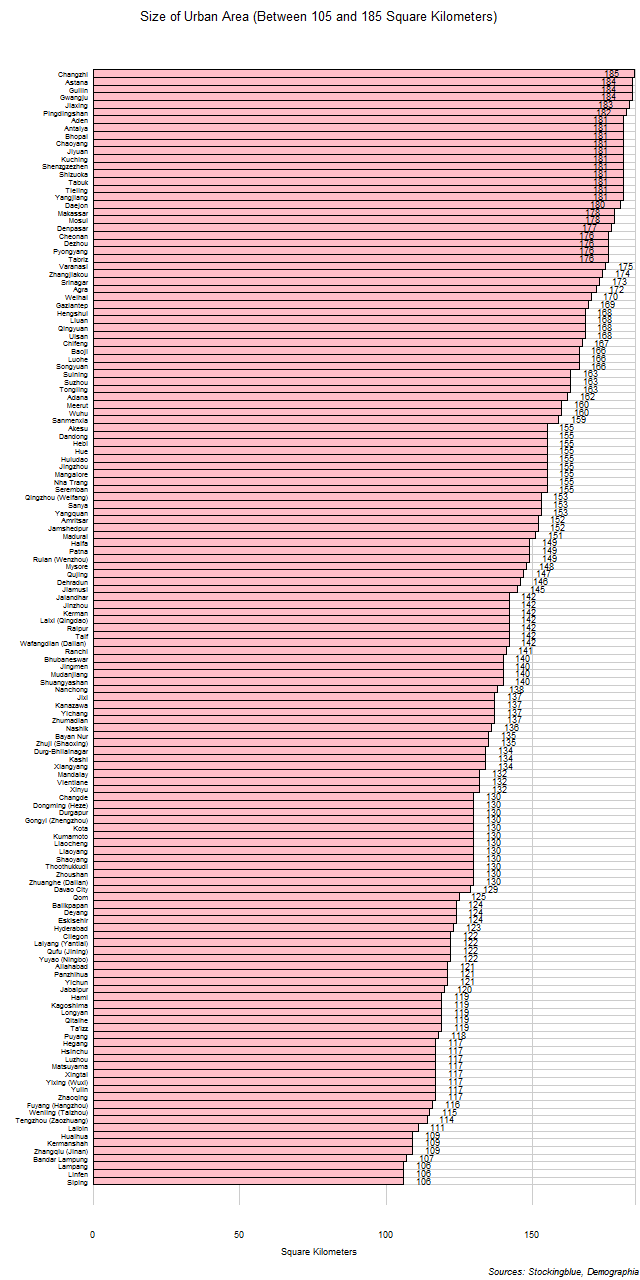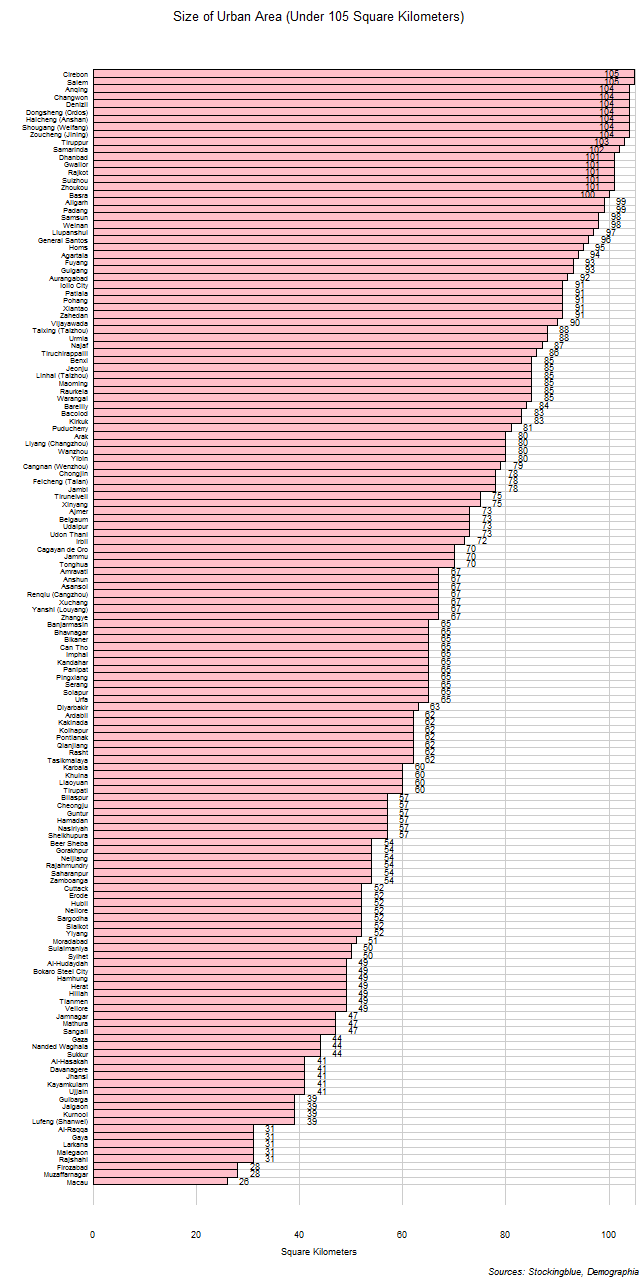
The chart above shows the urban area of each city with a population of over one million with an area over 360 square kilometers while the charts below show all urban areas with a population of over one million with an area between 185 square kilometers and 360 square kilometers, between 105 and 185 square kilometers, and below 105 square kilometers. The urban area has been normalized so as to avoid any inconsistencies with how cities and their metropolitan areas are defined by their governments. Each urban area has similar characteristics making this the definitive method with which to compare cities across various countries. Japan has the largest urban area by size by far.
Findings

- The difference between the urban area with the greatest size, Tokyo, and the urban area with the least, Macau, is 8,204 square kilometers (3,167.58 square miles).
- Tokyo has 316.54 times the urban area that Macau does.
- The median size of urban area with a minimum population of one million in Asia is 181.00 square kilometers (69.88 square miles) and the mean 371.00 square kilometers (143.25 square miles).
Caveats

- Data is from 2020.
- The methodology for how these urban areas have been defined can be found in the source link below. As of this writing this is the most reliable way to compare urban areas throughout the world.
- Some of these urban areas span several states, and the state that is being used here is the one where the core of the urban area is located. For instance, Milan's urban area spans both Italy and Switzerland, but since the core of the urban area is in Italy it would be listed as an Italian urban area and not a Swiss one.
- All figures are rounded to the nearest whole.
Details

Only 46 of the 54 Asian states have urban areas with at least one million people. Of these, China has 248; India has 108; Indonesia has 24; Japan has 21; Iran and Turkey each have 16; Pakistan has 14; South Korea has 11; Iraq and Saudi Arabia each have ten; the Philippines has nine; Vietnam has eight; Bangladesh, Malaysia, and Thailand each have six; Syria and Taiwan each have five; Israel, Kazakhstan, and Yemen each have four; Afghanistan, North Korea, the United Arab Emirates, and Uzbekistan each have three; Jordan and Myanmar each have two; and Armenia, Azerbaijan, Bahrain, Cambodia, Georgia, Hong Kong, Kuwait, Kyrgyzstan, Laos, Lebanon, Macao, Mongolia, Nepal, Oman, Palestine, Qatar, Singapore, Sri Lanka, Tajikistan, and Turkmenistan each have one.
Tokyo makes up just under one-twentieth of the total area of Asian urban areas with over one million inhabitants at 3.88%. It, along with Guangzhou, Beijing, Shanghai, and Nagoya make up one-tenth of the total area of Asian urban areas with over one million inhabitants at 11.57%. Adding in Jakarta, Bangkok, Osaka, Tianjin, Seoul, Delhi, and Kuala Lumpur brings it up to over one-fifth at 20.89%.
Three of the four urban areas with a population of over one million people that have an urban area of over 4,000 square kilometers are located in China, Japan has one. Seven of the 12 urban areas with a population of over one million people that have an area less than 40 square kilometers are located in India; Bangladesh, China, Macao, Pakistan, and Syria each have one.
China has the largest area covered by its urban areas of over one million people with a total of 37,609 square kilometers (14,520.92 square miles) distributed among its 248 urban areas. India has the second largest area covered by its urban areas of over one million people with a total of 8,667 square kilometers (3,346.35 square miles) distributed among its 108 urban areas.
Bhutan, the British Indian Ocean Territory, Brunei, Christmas Island, the Cocos (Keeling) Islands, Cyprus, Maldives, and Timor-Leste do not have any urban areas with a population of over one million inhabitants.
Sources
Demographia. 2021. "Demographia World Urban Areas: 16th Annual Edition." Accessed March 9, 2021. http://demographia.com/db-worldua.pdf.