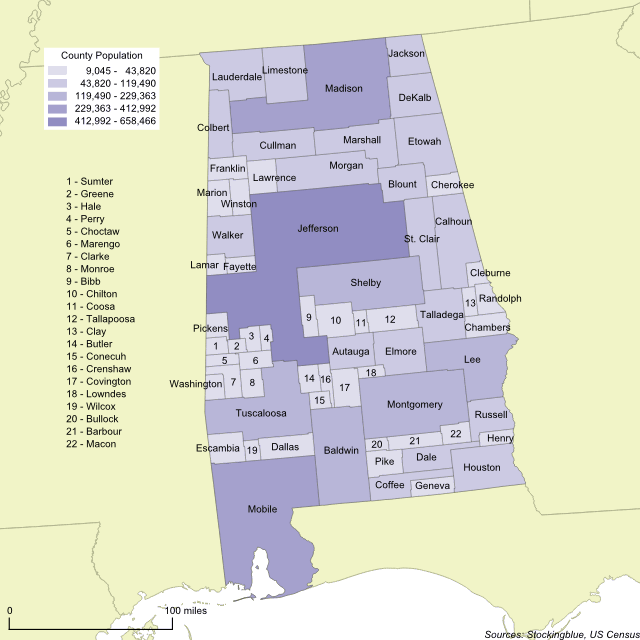
The geographically accurate cartogram above represents the population of Alabama's counties. The more populous a county is, the larger it is on the map. This cartogram shows that Jefferson, Madison, and Mobile are the most populous counties by far and together the three counties account for just under 30 percent of the state's total population. This, in a state with 67 counties.
Findings
- Nine counties make up over half the state's population leaving the remaining 58 counties with just less than half.
- Four counties (Jefferson, Mobile, Madison, and Montgomery) make up one-third of the state's population.
- Jefferson and Mobile counties make up one-fifth of the population.
Caveats
- The data is from 2010, the last year the Census took place.
- The borders represent the area of the county if it were based on population. The larger the population, the larger the county.
- The map is presented in an Albers equal-area conic projection.
- The choropleth classification is based on Jenks or natural breaks.
Details
Jefferson county tends to overwhelmingly vote Democratic as do Sumter, Greene, Hale, Marengo, Perry, Wilcox, Dallas, Lowndes, Montgomery, Macon, Bullock, and Russell. These counties account for 23.24 percent of the state's total population. In addition, Barbour and Conecuh counties tend to swing and they account for an additional 0.85 percent.
One should note, that Alabamians tended to vote for Blue Dog Democrats up until Newt Gingrich's Contract with America in the 1990s. Ever since then, voting Republican has become more palatable to the Alabama voter and they have continued to do so to the present day.
Tomorrow, one should keep an eye on voter turnout in Jefferson County to see if the Democrats decide to show up to the polls. Republican counties tend to be less populous and their results are likely to show up first. However, there are several small Democratic counties that should also report early results. Noting how these counties will skew will be key to predicting the ultimate outcome.
Data
| County | Population | Percent of Statewide Total |
|---|---|---|
| Jefferson | 658,466 | 13.78 |
| Mobile | 412,992 | 8.64 |
| Madison | 334,811 | 7 |
| Montgomery | 229,363 | 4.8 |
| Shelby | 195,085 | 4.08 |
| Tuscaloosa | 194,656 | 4.07 |
| Baldwin | 182,265 | 3.81 |
| Lee | 140,247 | 2.93 |
| Morgan | 119,490 | 2.5 |
| Calhoun | 118,572 | 2.48 |
| Etowah | 104,430 | 2.18 |
| Houston | 101,547 | 2.12 |
| Marshall | 93,019 | 1.95 |
| Lauderdale | 92,709 | 1.94 |
| St. Clair | 83,593 | 1.75 |
| Limestone | 82,782 | 1.73 |
| Talladega | 82,291 | 1.72 |
| Cullman | 80,406 | 1.68 |
| Elmore | 79,303 | 1.66 |
| DeKalb | 71,109 | 1.49 |
| Walker | 67,023 | 1.4 |
| Blount | 57,322 | 1.2 |
| Autauga | 54,571 | 1.14 |
| Colbert | 54,428 | 1.14 |
| Jackson | 53,227 | 1.11 |
| Russell | 52,947 | 1.11 |
| Dale | 50,251 | 1.05 |
| Coffee | 49,948 | 1.04 |
| Dallas | 43,820 | 0.92 |
| Chilton | 43,643 | 0.91 |
| Tallapoosa | 41,616 | 0.87 |
| Escambia | 38,319 | 0.8 |
| Covington | 37,765 | 0.79 |
| Lawrence | 34,339 | 0.72 |
| Chambers | 34,215 | 0.72 |
| Pike | 32,899 | 0.69 |
| Franklin | 31,704 | 0.66 |
| Marion | 30,776 | 0.64 |
| Barbour | 27,457 | 0.57 |
| Geneva | 26,790 | 0.56 |
| Cherokee | 25,989 | 0.54 |
| Clarke | 25,833 | 0.54 |
| Winston | 24,484 | 0.51 |
| Monroe | 23,068 | 0.48 |
| Bibb | 22,915 | 0.48 |
| Randolph | 22,913 | 0.48 |
| Macon | 21,452 | 0.45 |
| Marengo | 21,027 | 0.44 |
| Butler | 20,947 | 0.44 |
| Pickens | 19,746 | 0.41 |
| Washington | 17,581 | 0.37 |
| Henry | 17,302 | 0.36 |
| Fayette | 17,241 | 0.36 |
| Hale | 15,760 | 0.33 |
| Cleburne | 14,972 | 0.31 |
| Lamar | 14,564 | 0.3 |
| Clay | 13,932 | 0.29 |
| Crenshaw | 13,906 | 0.29 |
| Choctaw | 13,859 | 0.29 |
| Sumter | 13,763 | 0.29 |
| Conecuh | 13,228 | 0.28 |
| Wilcox | 11,670 | 0.24 |
| Coosa | 11,539 | 0.24 |
| Lowndes | 11,299 | 0.24 |
| Bullock | 10,914 | 0.23 |
| Perry | 10,591 | 0.22 |
| Greene | 9,045 | 0.19 |
Sources
United States Census Bureau. "Annual Estimates of the Resident Population: April 1, 2010 to July 1, 2016." Accessed December 8, 2017. http://factfinder2.census.gov.