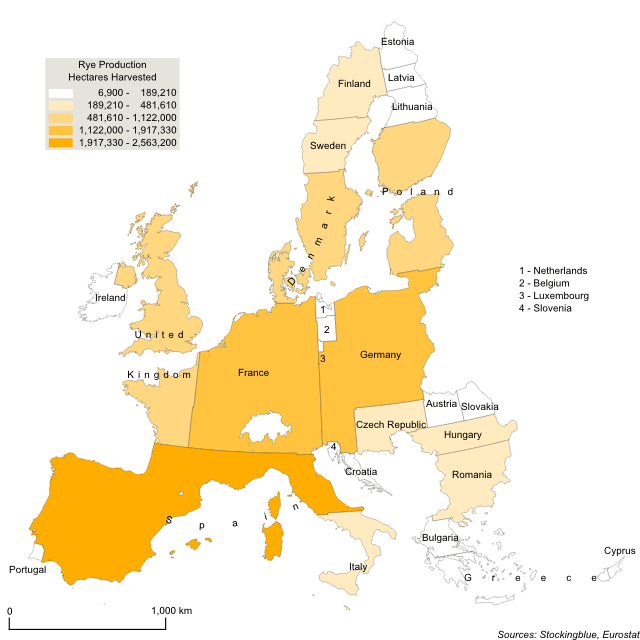
Today a look at barley production in the European Union. Spain dedicates the greatest amount of land but France and Germany are not far behind. These three countries combined account for just under half the land dedicated to barley production in the EU.
Findings
- Spain accounts for the greatest amount of land dedicated to barley production. It alone is responsible for over one out of every five hectares alloted to the crop in the EU.
- Luxembourg, the smallest producer only attributes 0.06 percent of the total hectares in the EU to harvesting barley.
- Three states (Spain, France, and Germany) are responsible for just under half the hectares dedicated to barley production.
- Malta is the only state in the Union to not dedicate any land to growing the crop.
Caveats
- The data is from 2016.
- The borders represent the area of the state if it were based on barley production, the larger the state, the more hectares it dedicates to harvesting barley. The location of the states on the map is irrelevant.
- The map is presented in an Albers equal-area conic projection.
- The choropleth classification is based on Jenks or natural breaks.
- Malta does not dedicate any land to barley production and thus does not appear on the map.
Details
Western European states are most keen on harvesting barley. The only Eastern European state to dedicate a sizable amount of land is Poland. It is also peculiar that the low countries which are sandwiched between France and Germany do not bother with the crop so much considering that France and Germany dedicate the second and third largest amount of land to harvesting the crop.
The total reported area dedicated to the crop in the European Union is 12,301,530 hectares (30,397,743 acres) or 123,015.3 square kilometers (47,496.47 square miles).
Data
| State | Hectares Harvested | Percent of EU Total |
|---|---|---|
| Spain | 2,563,200 | 20.84 |
| France | 1,917,330 | 15.59 |
| Germany | 1,605,000 | 13.05 |
| United Kingdom | 1,122,000 | 9.12 |
| Poland | 915,320 | 7.44 |
| Denmark | 706,900 | 5.75 |
| Romania | 481,610 | 3.92 |
| Finland | 435,900 | 3.54 |
| Czech Republic | 325,730 | 2.65 |
| Sweden | 318,920 | 2.59 |
| Hungary | 313,090 | 2.55 |
| Italy | 249,370 | 2.03 |
| Ireland | 189,210 | 1.54 |
| Lithuania | 172,540 | 1.4 |
| Bulgaria | 159,830 | 1.3 |
| Austria | 140,430 | 1.14 |
| Estonia | 135,400 | 1.1 |
| Greece | 132,800 | 1.08 |
| Slovakia | 114,970 | 0.93 |
| Latvia | 94,400 | 0.77 |
| Croatia | 56,480 | 0.46 |
| Belgium | 55,430 | 0.45 |
| Netherlands | 34,430 | 0.28 |
| Portugal | 20,620 | 0.17 |
| Slovenia | 19,180 | 0.16 |
| Cyprus | 14,540 | 0.12 |
| Luxembourg | 6,900 | 0.06 |
| Malta | 0 | 0 |
Sources
Eurostat. 2017. "Database - Eurostat." Accessed November 26, 2017. http://ec.europa.eu/eurostat/data/database.