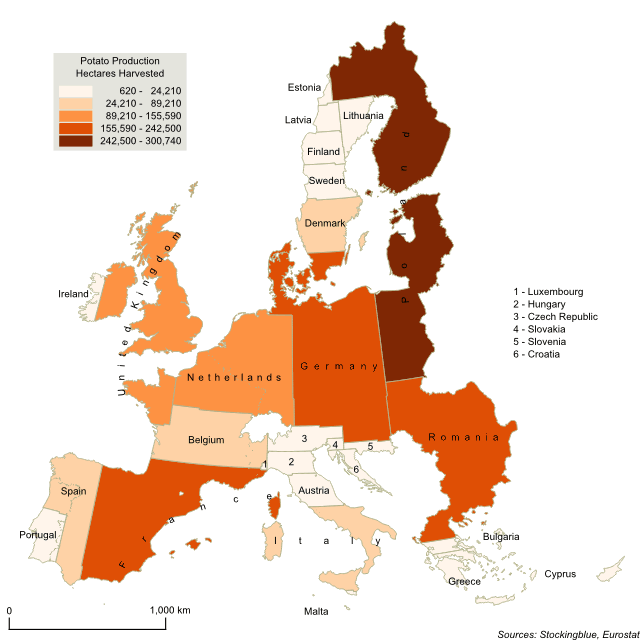
Last week, the focus was on common Thanksgiving foods and which states produce them. Today a look at potato production in the European Union. Unlike the United States, there is no one state that completely dominates production of the crop. Rather, in the EU it takes both Germany and Poland to take up the share that Idaho takes up in the US. Not unlike the US though, potatoes are primarily produced in northern states.
Findings
- Poland harvests the most hectares of potatoes accounting for just under one-fifth of the Union's total hectares dedicated to the crop.
- Luxembourg harvests only 0.04 percent of the total hectares dedicated to potatoes in the EU.
- Four states (Poland, Germany, Romania, and France) are responsible for over half the hectares dedicated to potato production.
Caveats
- The data is from 2013.
- The borders represent the area of the state if it were based on potato production. The location of the states on the map is irrelevant.
- The map is presented in an Albers equal-area conic projection.
- The choropleth classification is based on Jenks or natural breaks.
Details
Although northern states produce the majority of the crop, extreme northern states do not. It is states on the Great European Plain and Romania that dedicate the most land to potato production.
The total reported area dedicated to the crop in the European Union is 1,688,330 hectares (4,171,954 acres) or 16,883.3 square kilometers (6,518.68 square miles).
Data
| State | Hectares Harvested | Percent of EU Total |
|---|---|---|
| Poland | 300,740 | 17.81 |
| Germany | 242,500 | 14.36 |
| Romania | 186,240 | 11.03 |
| France | 179,000 | 10.6 |
| Netherlands | 155,590 | 9.22 |
| United Kingdom | 139,000 | 8.23 |
| Belgium | 89,210 | 5.28 |
| Spain | 72,140 | 4.27 |
| Italy | 48,140 | 2.85 |
| Denmark | 46,100 | 2.73 |
| Sweden | 24,210 | 1.43 |
| Czech Republic | 23,410 | 1.39 |
| Portugal | 23,300 | 1.38 |
| Finland | 21,700 | 1.29 |
| Lithuania | 21,640 | 1.28 |
| Austria | 21,220 | 1.26 |
| Greece | 18,030 | 1.07 |
| Hungary | 16,410 | 0.97 |
| Latvia | 10,900 | 0.65 |
| Croatia | 9,870 | 0.58 |
| Ireland | 9,040 | 0.54 |
| Bulgaria | 8,380 | 0.5 |
| Slovakia | 8,260 | 0.49 |
| Cyprus | 5,040 | 0.3 |
| Estonia | 3,710 | 0.22 |
| Slovenia | 3,160 | 0.19 |
| Malta | 770 | 0.05 |
| Luxembourg | 620 | 0.04 |
Sources
Eurostat. 2017. "Database - Eurostat." Accessed November 26, 2017. http://ec.europa.eu/eurostat/data/database.