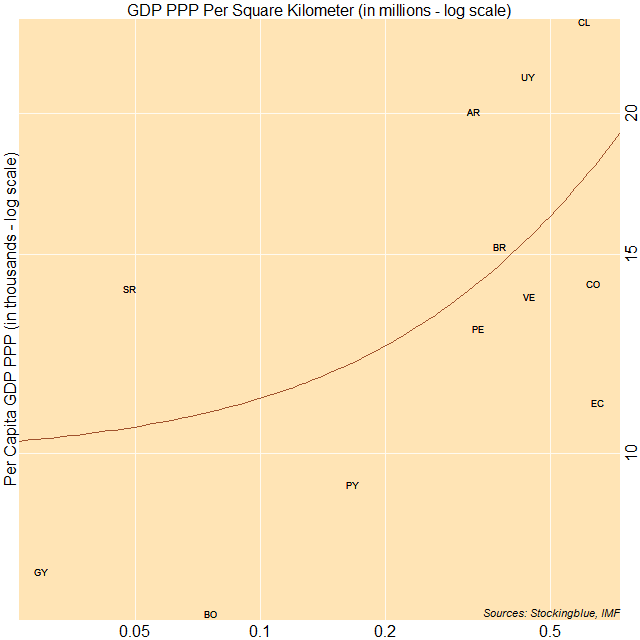
The correlation between per capita gross domestic product based on purchasing power parity (GDP PPP) and GDP PPP per area in South America is moderately strong. The three largest economies on a per capita basis have either a moderate or high per area GDP relative to other countries on the continent.
Findings
- The correlation coefficient between per capita Gross Domestic Product (GDP) in Purchasing Power Parity (PPP) and minimum wage in South America is 0.53.
- As the per capita GDP PPP increases in South America, the per area GDP PPP somewhat increases.
- Bolivia has the lowest per capita GDP PPP and the third lowest per area GDP PPP.
- Guyana has the lowest per area GDP PPP and the second lowest per capita GDP PPP.
- Chile has the largest per capita GDP PPP and the third highest per area GDP PPP on the continent.
- Ecuador on the other hand, has the highest per area GDP PPP but the fourth lowest per capita GDP PPP.
Caveats
- As always, correlation does not imply causation.
- French Guiana and the South Georgia and the South Sandwich Islands were missing data.
Details
Every country that has a per capita GDP PPP of at least 15,000 international dollars, also has a GDP PPP per square kilometer of at least 300,000 international dollars. However, there are several countries with a per capita GDP PPP below 15,000 international dollars that have a GDP PPP per square kilometer of at least 300,000 international dollars.
Countries that make less than 200,000 international dollars per square kilometer also have a per capita GDP PPP of less than 15,000 international dollars.
Country Codes
| Code | Country | GDP PPP Per Square Kilometer | Per Capita GDP PPP |
|---|---|---|---|
| AR | Argentina | 328,303.84 | 20,047 |
| BO | Bolivia | 76,105.45 | 7,218 |
| BR | Brazil | 377,655.93 | 15,242 |
| CL | Chile | 603,015.2 | 24,113 |
| CO | Colombia | 632,315.99 | 14,130 |
| EC | Ecuador | 650,901.99 | 11,109 |
| GY | Guyana | 29,762.43 | 7,873 |
| PY | Paraguay | 167,190.33 | 9,396 |
| PE | Peru | 334,349.25 | 12,903 |
| SR | Suriname | 48,596.02 | 13,988 |
| UY | Uruguay | 441,506.11 | 21,527 |
| VE | Venezuela | 443,077.68 | 13,761 |